56 57
Contour
®
next GEN blood glucose monitoring system
TECHNICAL INFORMATION
Technical Information: User Accuracy
The Contour next GEN meter results may vary slightly from
your actual blood glucose value due to slight dierences in testing
technique and the natural variation in test technology.
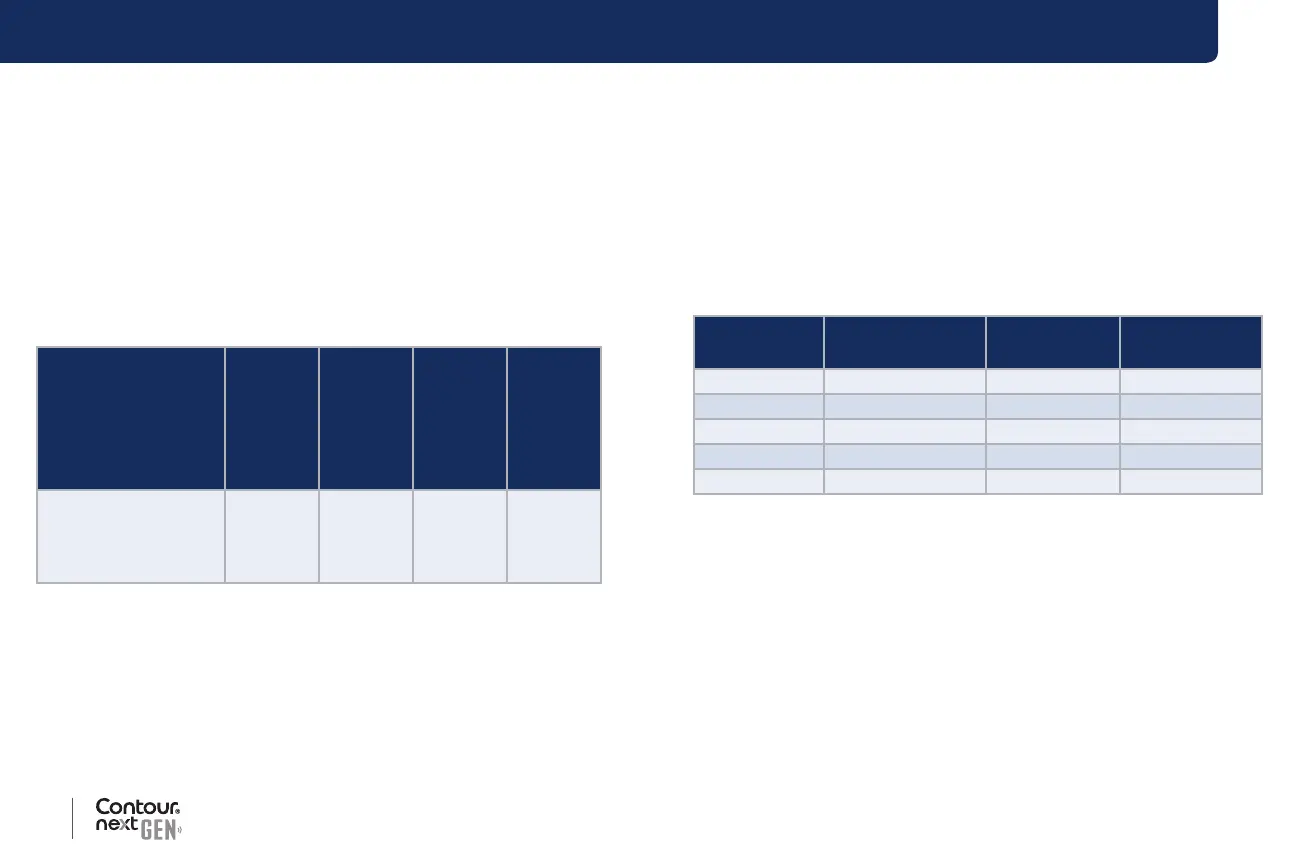
The table below
shows the results where typical users enrolled in a clinical study used
the Contour next GEN meter to measure their blood glucose levels.
For example, in this study, the Contour next GEN meter displayed
results within 15% of their actual blood glucose level in 366 out of 371
measurements as compared to an approved lab instrument.
Table 1: System accuracy results for glucose concentrations
across the entire tested range
Dierence range
between the actual
blood glucose
level and the
Contour next Gen
meter result
Within
± 5%
Within
± 10%
Within
± 15%
Within
± 20%
Percent
(and number) of
samples within
specied range
64.96%
(241/371)
93.53%
(347/371)
98.65%
(366/371)
99.19%
(368/371)
Technical Information: Precision
A measurement repeatability study was conducted with the
Contour next GEN blood glucose monitoring system using
5 venous whole blood specimens with glucose levels from
39 mg/dL to 348 mg/dL. With each blood specimen, each of 3 lots
of Contour next test strips was tested 10 times on each of
10 instruments for a total of 300 readings. The following precision
results were obtained.
Table 1: System repeatability results for
Contour next GEN
meter using Contour next test strips
Mean, mg/dL
Pooled Standard
Deviation, mg/dL
95% CI of SD,
mg/dL
Coecient of
Variation, %
40.1 1.1 1.04–1.23 2.8
78.6 1.3 1.21–1.43 1.7
137.5 2.0 1.84–2.18 1.5
212.6 3.3 3.07–3.64 1.6
341.2 4.4 4.02–4.76 1.3
 Loading...