UM-0085-B09 DT80 Range User Manual Page 155
RG
• Select the mimic reload rate, i.e. the rate at which new data will be requested from the logger. There is no point
setting this any faster than the logger's sample rate for the schedule
• Press Create mimic
After creating the mimic, you can change any of these settings by clicking the chart mimic's Configure button to bring up
the chart configuration dialog. You are also able to set the trace colour, as well as the Y-axis scaling and labels.
Don't forget to press Save mimics (top right of the screen) to save all mimics to the logger – otherwise they will be lost
when you close or reload the browser window.
Bar Chart Mimics
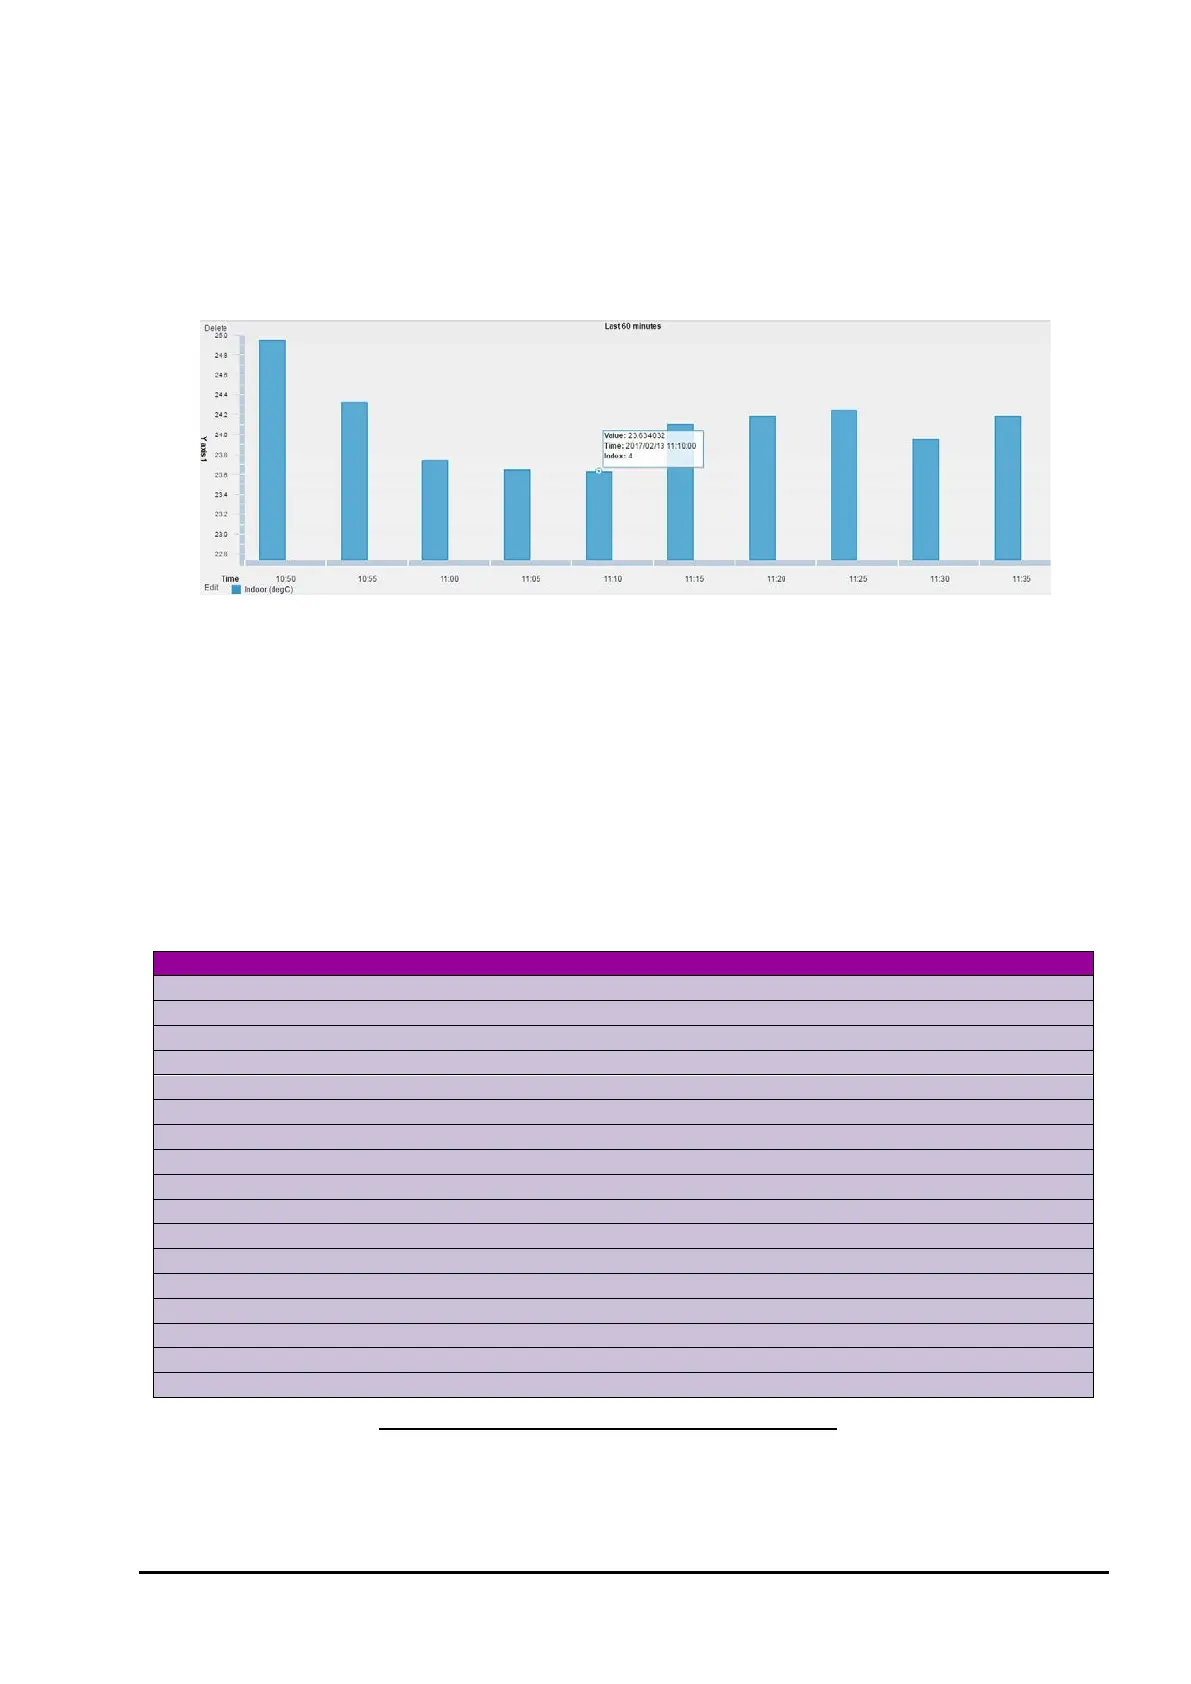
Figure 49: Bar chart mimic
Bar chart mimics are similar to trend charts in that they both plot a channel's value versus time. The differences are:
• Bar charts break the displayed time window into discrete intervals, one per displayed bar. For example, if the
time window is one day then the sample interval is one hour.
• With bar charts the time window is chosen from a list of pre-defined values (for trend charts any window length
can be specified).
• For some of the available bar chart time window selections, the window end time is "rounded up" (for a trend
chart, the end time is always "now"). For example, if "This hour" is selected then the window end time will be the
end of the current hour.
• Only a single channel can be plotted on each bar chart. Figure 49 shows a typical bar chart.
Bar Chart Time Windows
Creating a bar chart mimic is very similar to creating a trend chart. As noted above, however, the time window is
specified differently. The following time windows are available:
24 1 hour 00:00 today
Sunday/Monday (selectable)
28-31 1 day 1
of this month
12 5 min start of previous hour
7 1 day last Sunday/Monday (selectable)
24 1 hour 24 hours ago
12 1 month 12 months ago
Bar charts work by taking the first logged data point after the end of a bar's time interval, and using that as the value for
the bar. All other data points are discarded. Bar chart mimics do not perform any averaging on the data.