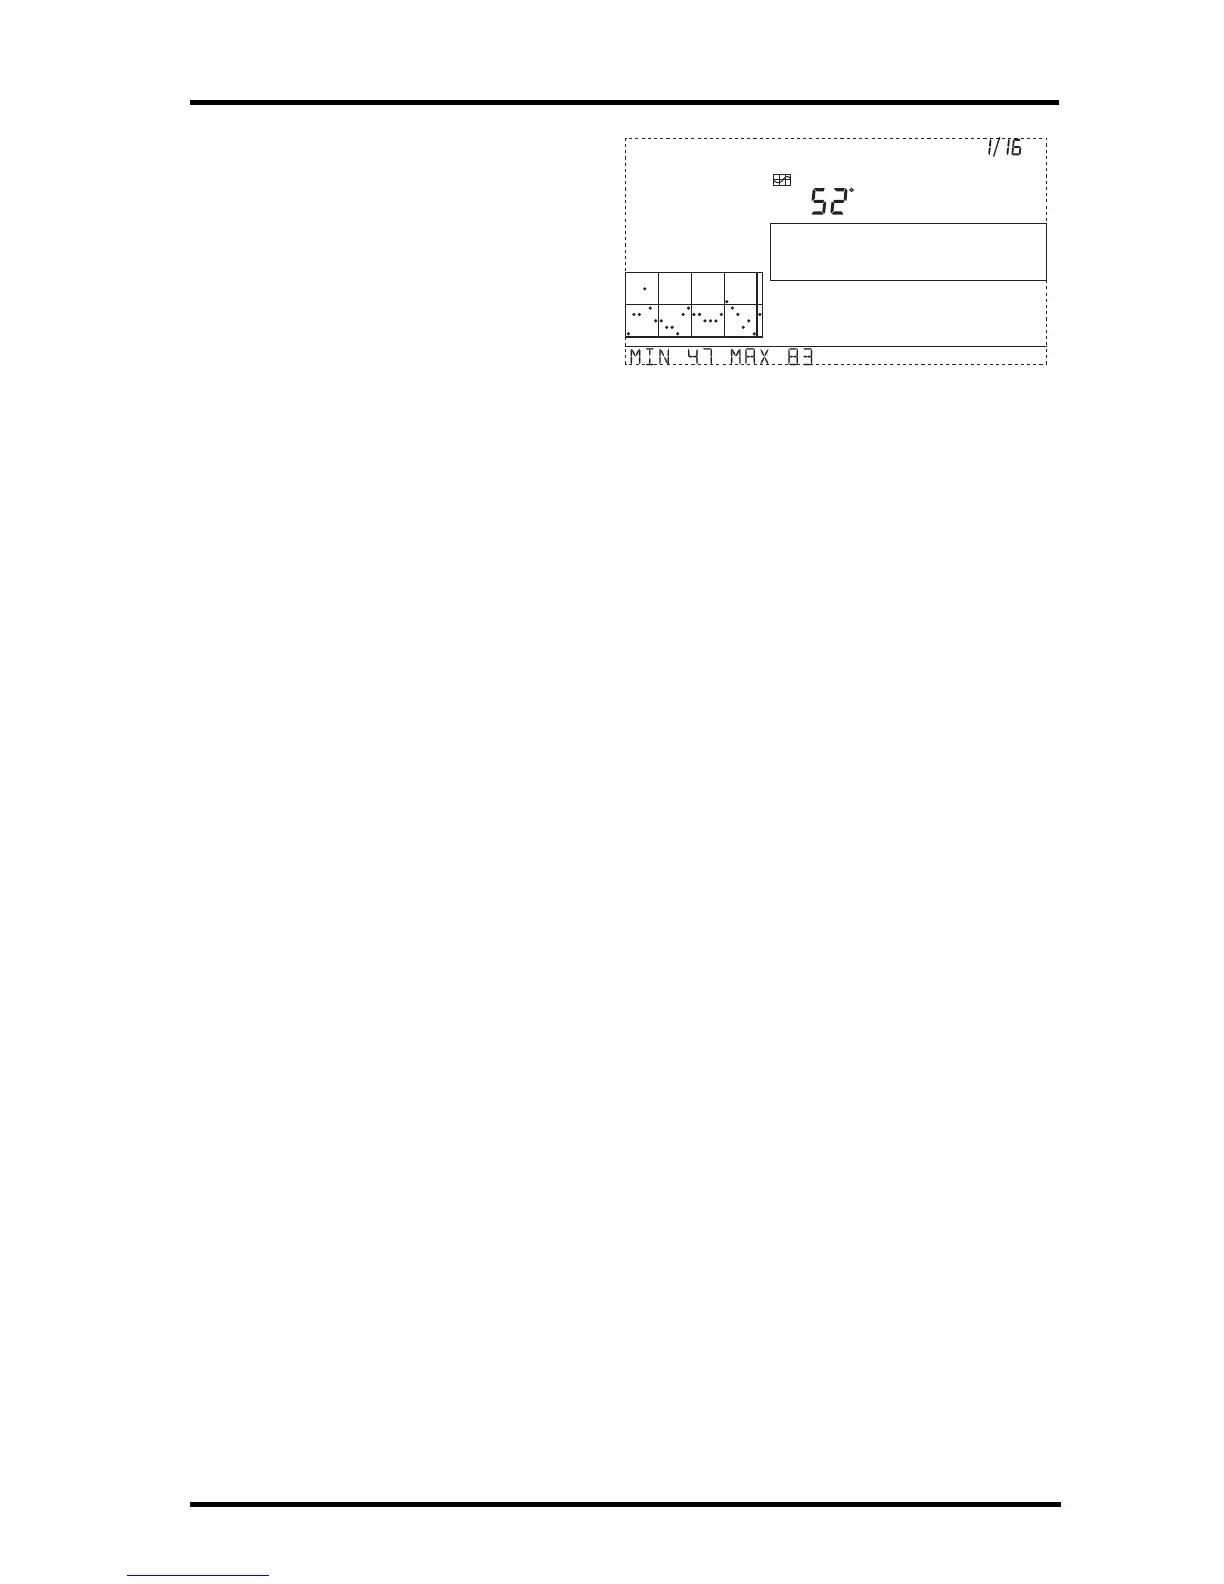
Graph Mode
32
If you press the - key the graph
shifts from the last 24 hours to the
last 24 days. Now each dot repre-
sents the high recorded on the day
shown in the date field. To see the
lows recorded in the last 24 days,
press HI/LOW. Press the < and >
keys to move between days.
By pressing the - key again, the
graph shifts to show the highs of the
last 24 months. As before, use the < and > keys to move between months. Press HI/
LOW to shift between the highs and lows.
By pressing the - key again, the graph shifts one more time to show the highs of the last
24 years. Press HI/LOW to shift between highs and lows.
The console beeps when you’ve reached the first or last possible value or time span for
the graph. Since the console only graphs data collected by the station, the graphs can
only show data collected since the station was first installed.
View graphs of all other variables the same way.
1. Select the variable you want to view.
2. Press GRAPH.
3. Use the < and > keys to select different variables.
4. Press the + key to shorten the time range.
5. Press the - key to lengthen the time range.
6. Press HI/LOW to shift between highs and lows.
7. Press DONE to exit.
GRAPH
Vertical Scale: 5
TEMP OUT
F
Last 24 days
day
Every 1
HIGHS