Graph Mode
33
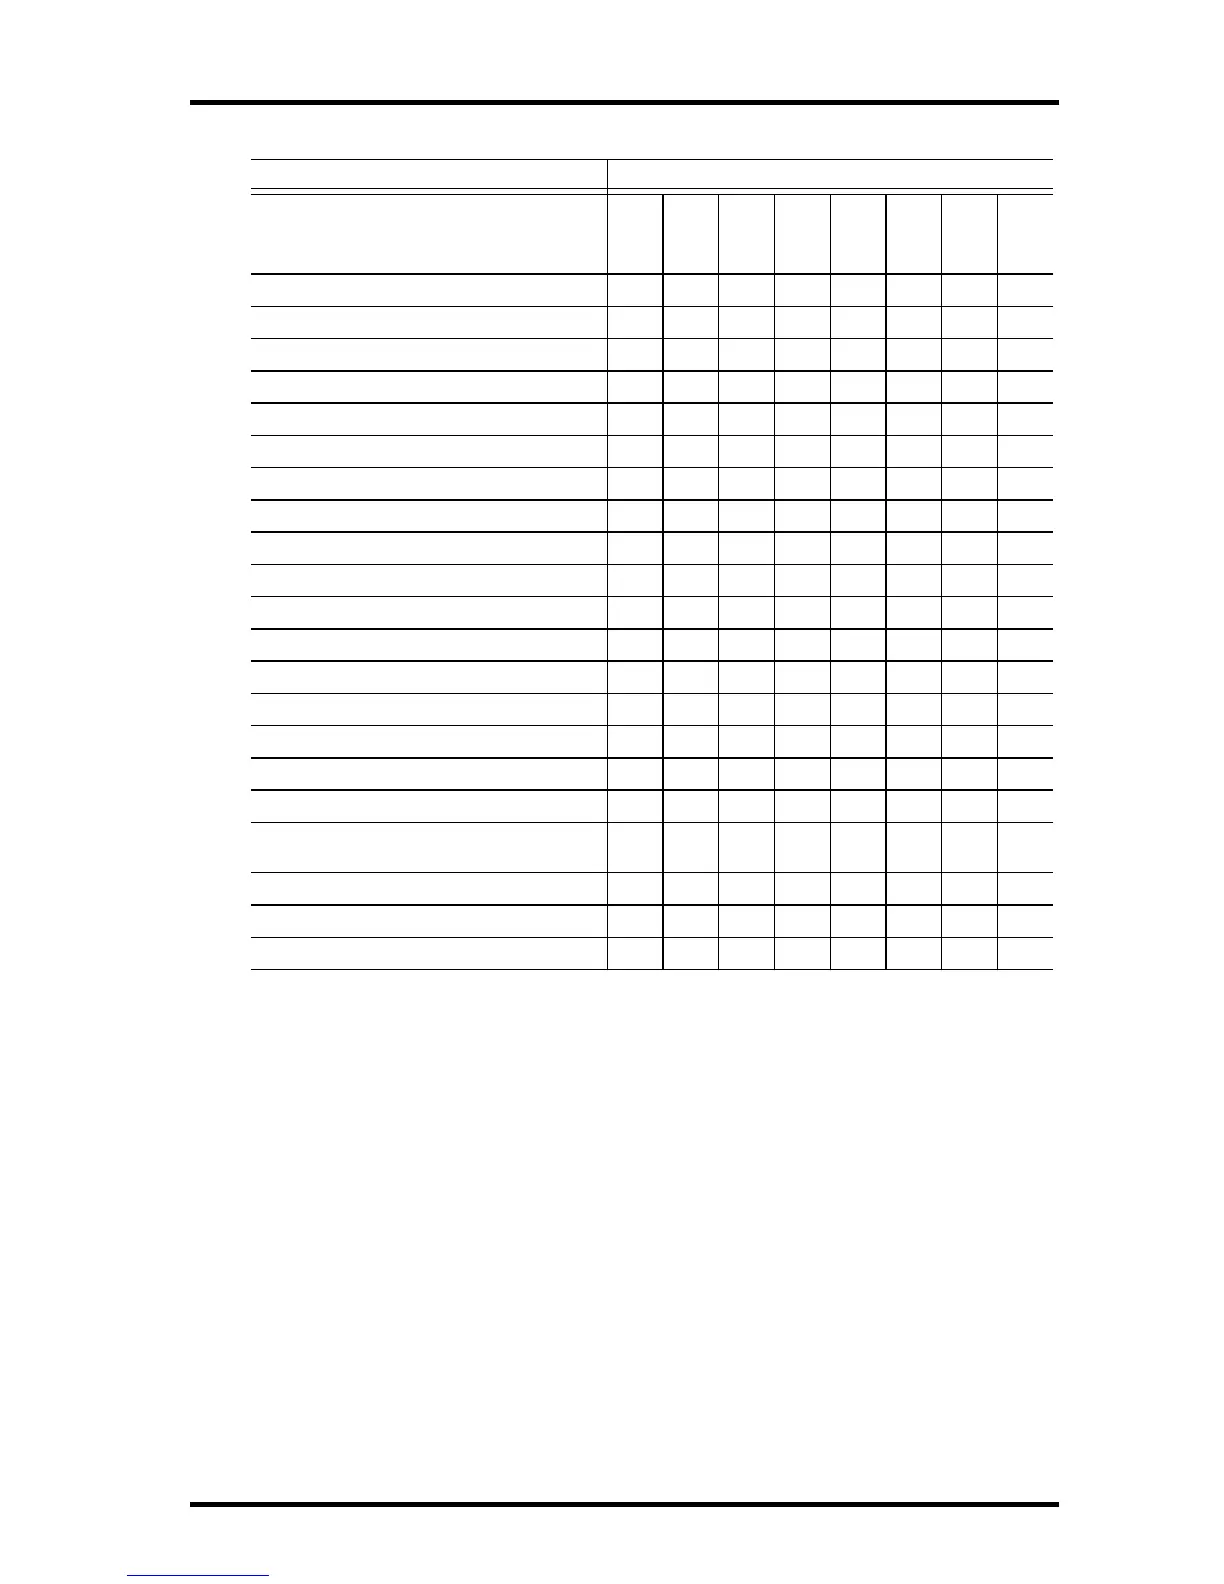
Vantage Pro2 Console Graphs
Weather Variable Available Graphs*
Current
1 Min
10 Min
15 Min
Hourly
Daily
Monthly
Yearly
Barometric Pressure C C C H, L H, L
Evapotranspiration (ET)** T TTTT
Humidity, Inside C C H, L H, L
Humidity, Outside C C H, L H, L
Dew Point C C H, L H, L
Leaf Wetness*** C C H, L
Rain T TTTTT
Storm****
Rain Rate H H HHHH
Soil Moisture C C H, L
Solar Radiation** A A H
Inside Temperature C C H, L H, L
Outside Temperature C C H, L H, L H, L
Heat Index Temperature C C H H
Temp/Hum/Sun/Wind (THSW) Index** C C H H
Wind Chill Temperature L L L L
UV Radiation Index***** A A H C
UV Radiation MED (Minimal Erythermal
Dose)*****
TTT
Wind Speed A A A, H H H H
Direction of High Wind Speed Y Y Y Y
Dominant Wind Direction A A A A
* A = Average, H = Highs, L = Lows, T =Totals, Y = Yes, C = Current reading at the end of each
period
** Requires solar radiation sensor, *****Requires UV sensor
*** Requires Wireless Leaf & Soil Moisture Temperature station
**** Graphs the last 24 storm events and doesn’t follow the same graph conventions as other
variables.