SD Series Dry Cabinets Setup and Operation Manual | A55-7379-00 Rev: 2.0.0 Page 27
7.0 NETWORK DASHBOARD
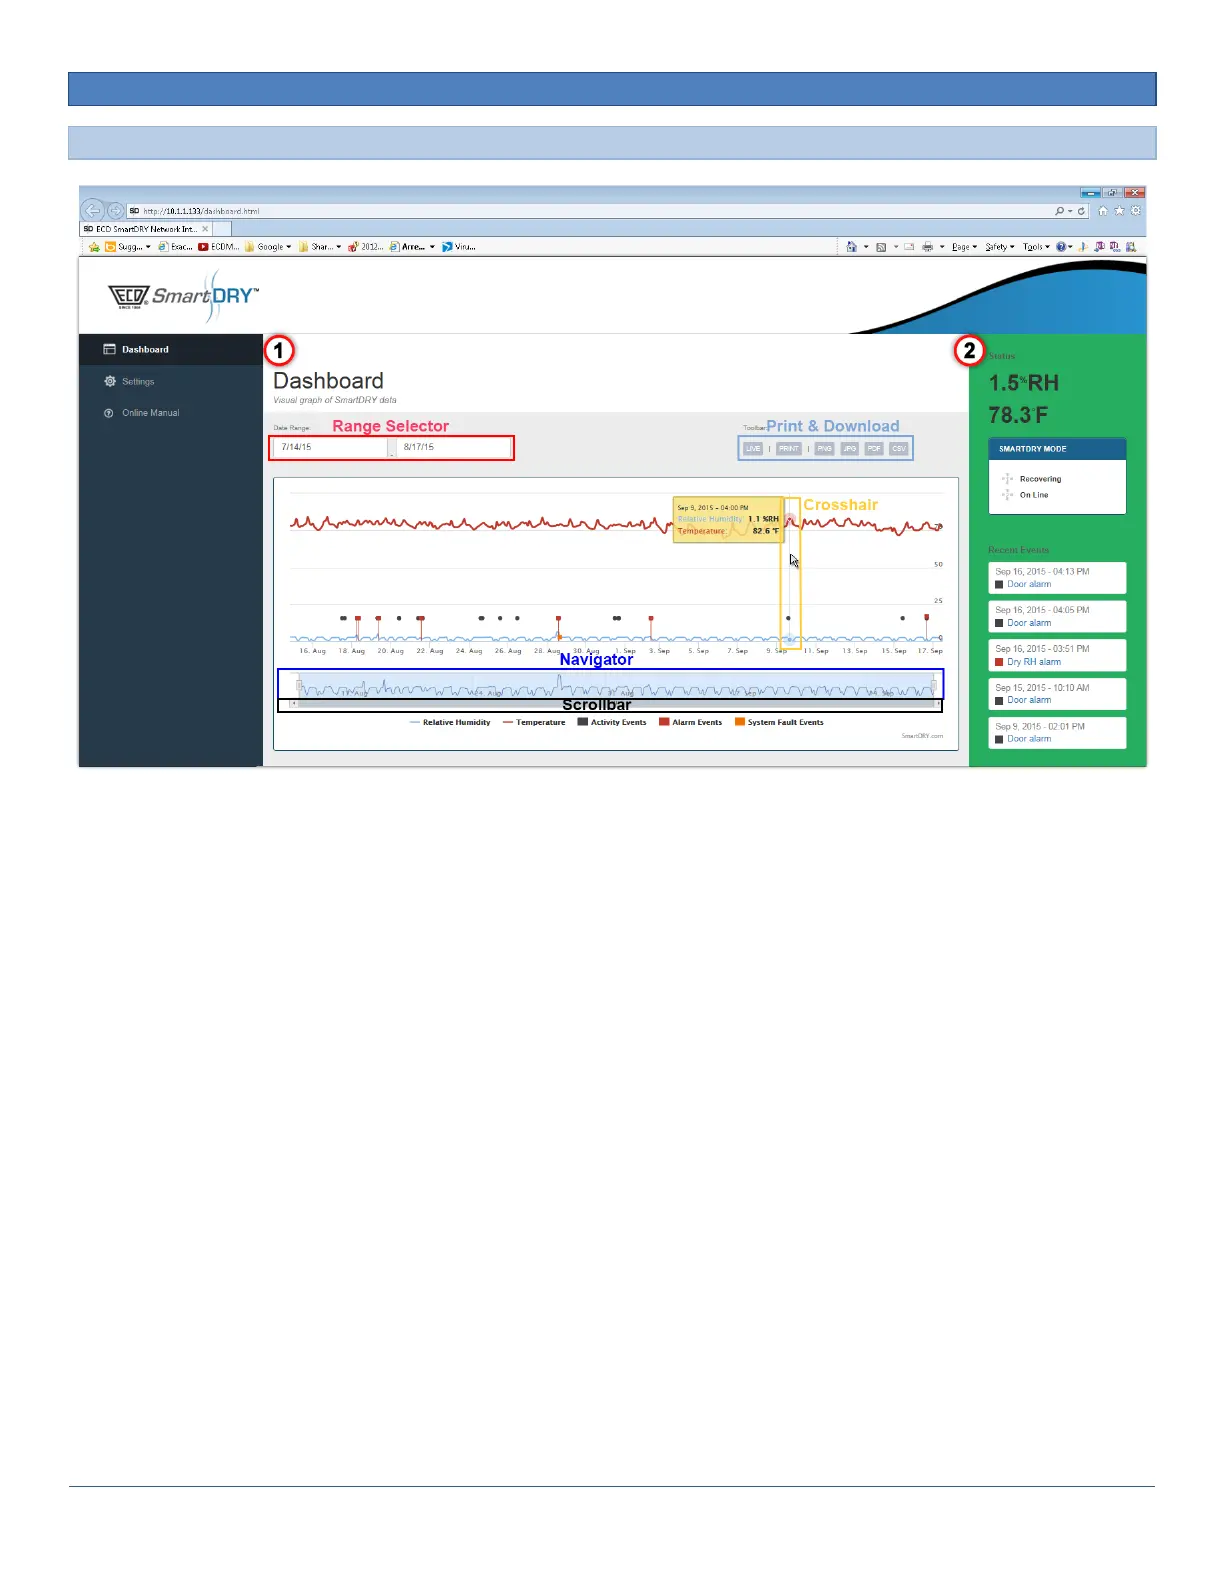
7.1 DASHBOARD
1) Data Graph:
o Crosshair - The Data Graph displays a line connecting the points with their corresponding axis.
o Range Selector: The range selector is a tool for selecting ranges to display within the chart. It pro-
vides buttons to select preconfigured ranges in the chart (1, 3, 6 month etc). It also provides input
boxes where min and max dates can be manually input.
o Print and Download current graph view - allows the currently data displayed on the graph to be
printed or saved (PNG Image, JPEG Image, PDF Document, or SVG Vector Image).
o Navigator - Displays a view of the entire data set. It provides tools to zoom in and out on parts of
the data as well as panning across the dataset.
o Scrollbar - Offers a means of panning over the X axis of a chart.