16
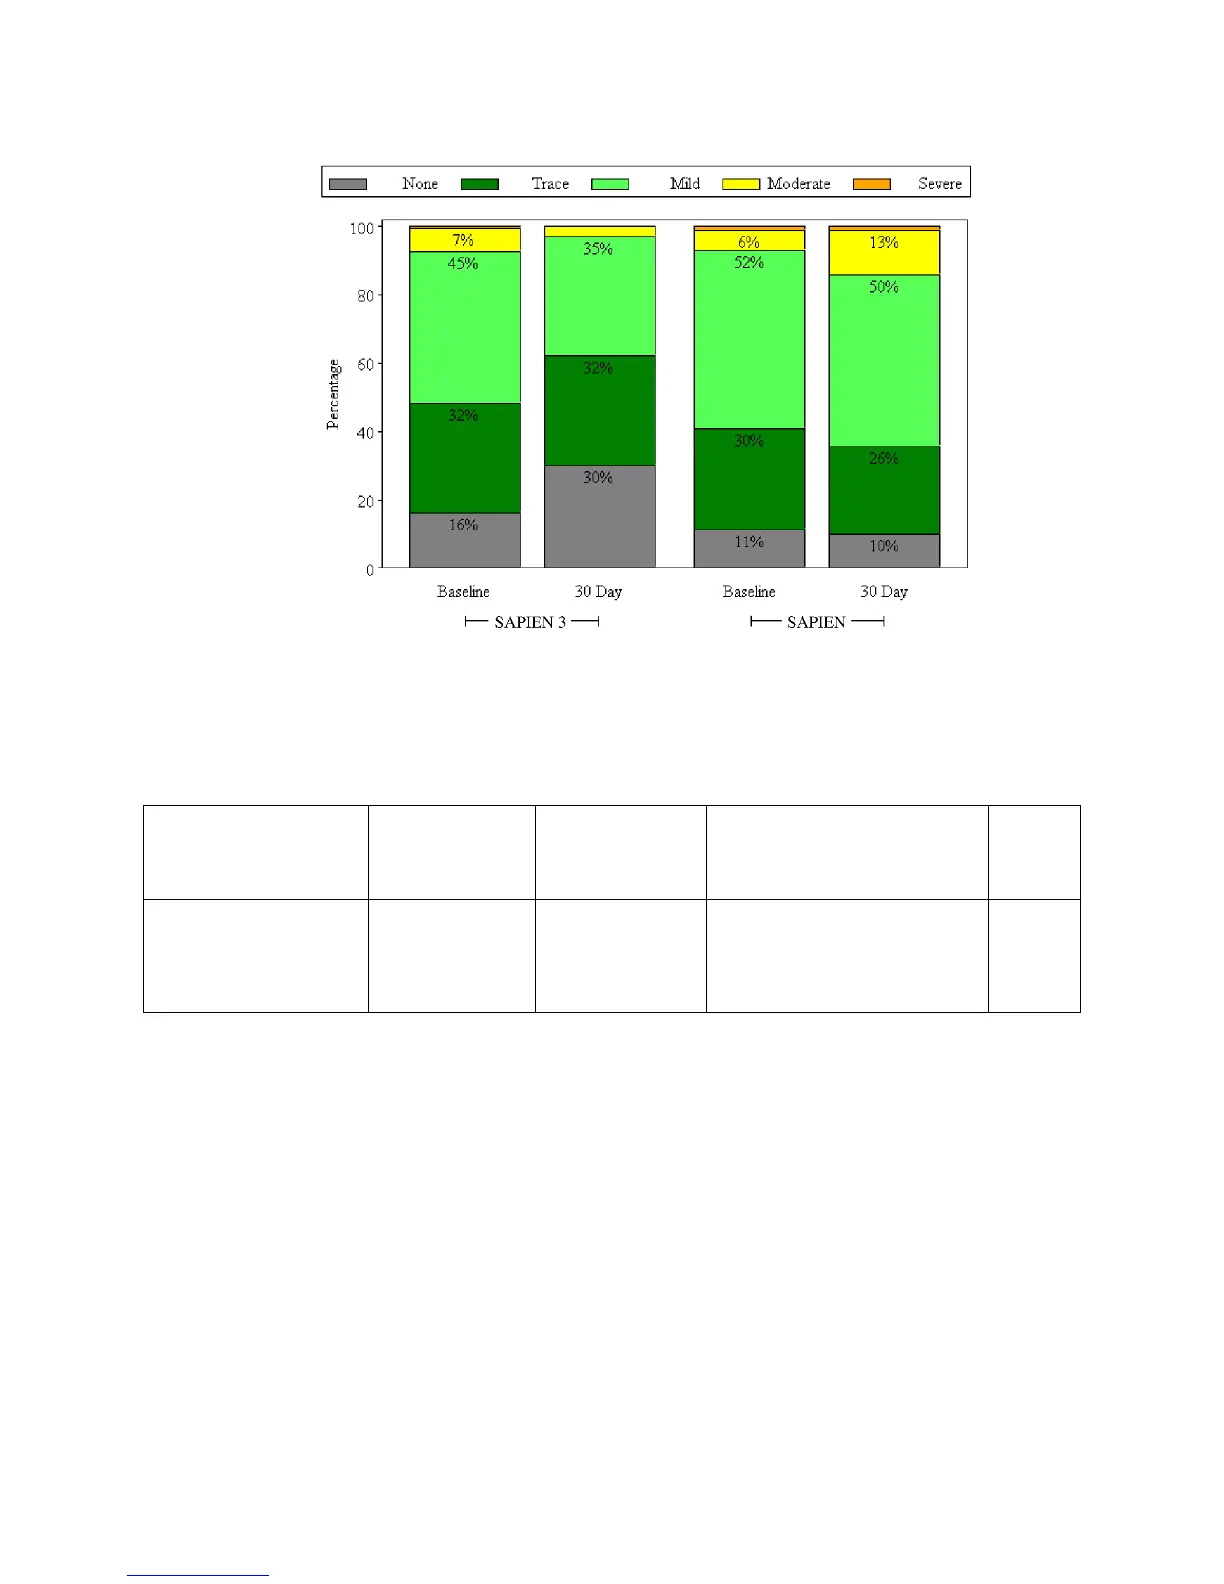
Aortic Insufficiency by Visit –
SAPIEN 3 Valve (PIIS3HR VI Population) vs. SAPIEN Valve
The proportion of patients with AI ≥ moderate at 30 days was 3.0% in the SAPIEN 3 cohort and 14.3% in
the SAPIEN cohort, which were found to be statistically significantly different (p=0.0051; Table 9).
Table 9:
Aortic Insufficiency at 30 Days
(SAPIEN 3 Valve vs. SAPIEN Valve VI Population)
Event at 30 Days
SAPIEN 3
Valve
(N = 583)
SAPIEN Valve
(N = 326 )
Difference in Average
Treatment Effect on the
P-value
AI ≥Moderate, n/Total
no. (%) [95% CI]
16/532
(3.0%)
[1.7%, 4.8%]
1
40/280
(14.3%)
[10.4%,
18.9%]
1
-13.1%
[-22.2%, -3.9%]
2
0.0051
1
95% Clopper-Pearson Exact confidence interval.
2
The Wald-type two-sided 90% confidence interval using weighted mean and SD is provided
The rate of major vascular complications at 30 days post implantation is shown in Figure 4. The rate was
5.0% for the SAPIEN 3 cohort and 10.1% for the SAPIEN cohort, which were found to be not statistically
significantly different (p=0.0578; Table 10).