36
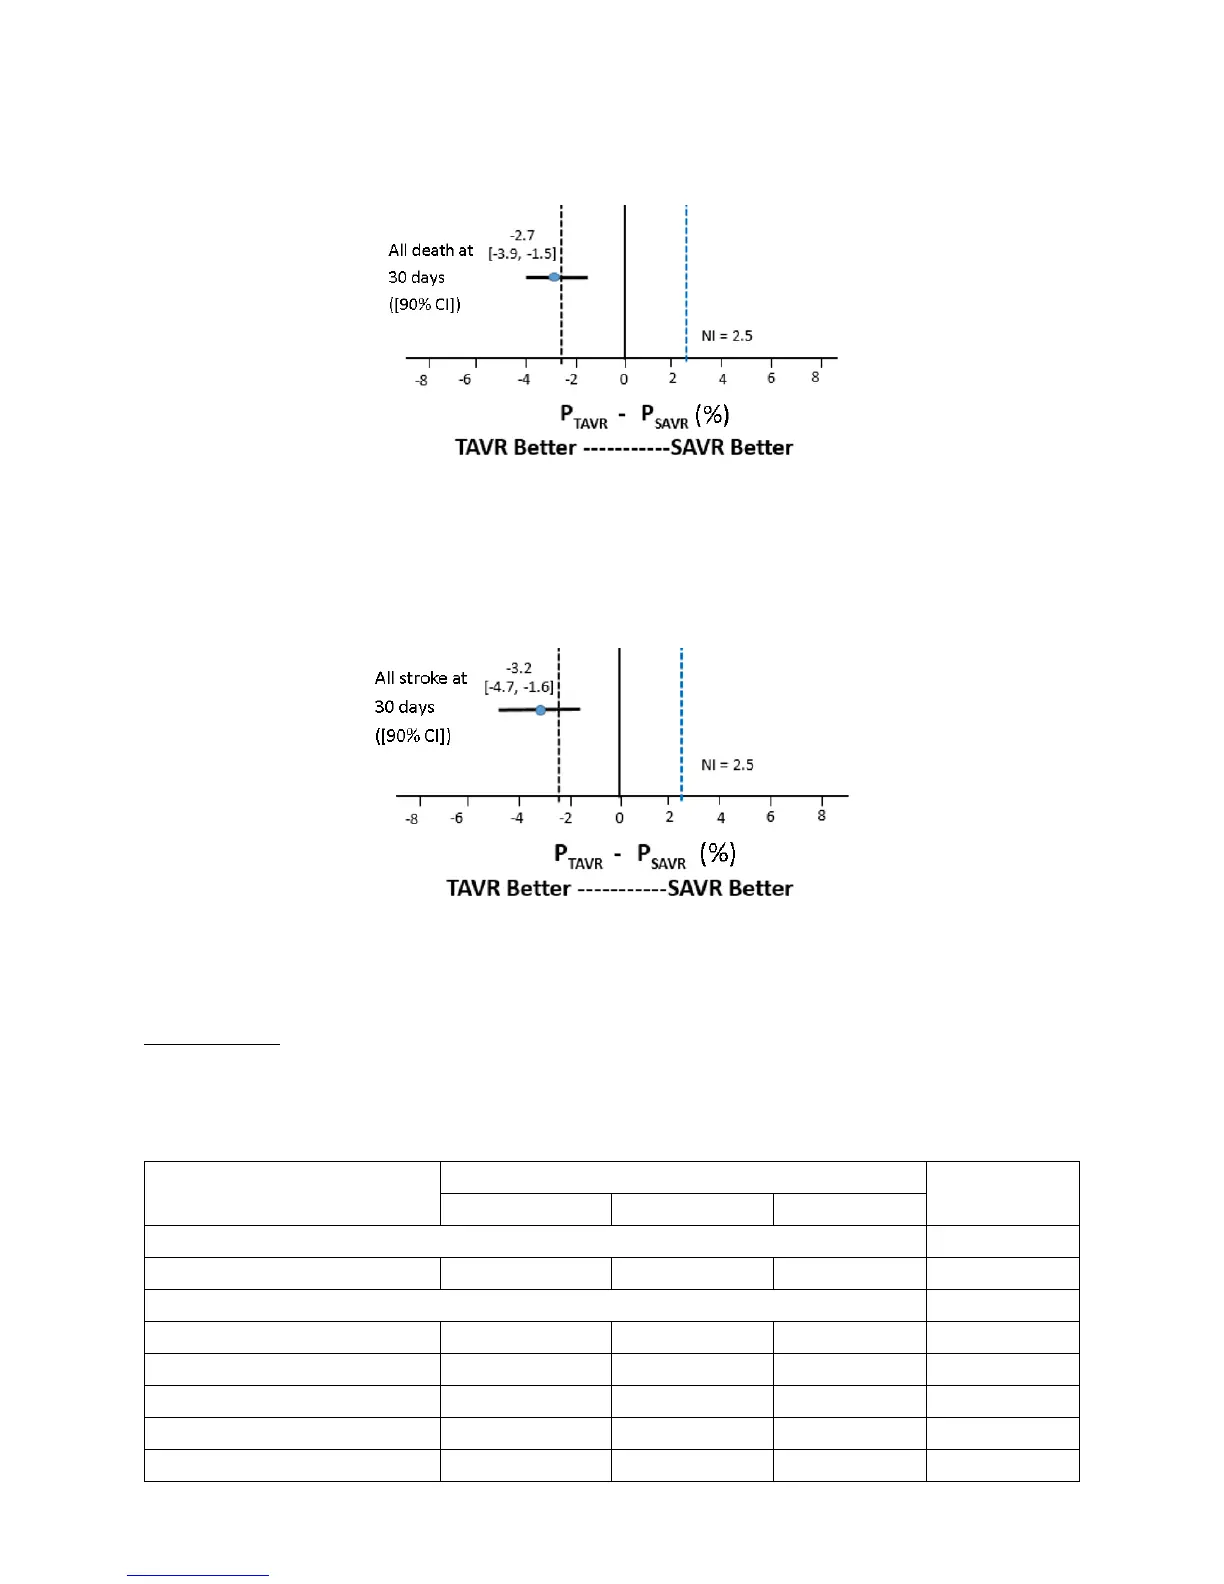
The forest plots for all-cause death and all stroke at 30 days are provided in Figures 22 and 23,
respectively.
Figure 22: Forest Plot – All-Cause Death at 30 Days (VI Population)
Note: As part of a pre-specified hiearchy, the hypothesis for this endpoint was tested using a
hierarchical gatekeeping approach. The confidence interval shown here was not adjusted for
multiplicity per the gatekeeping approach.
Figure 23: Forest Plot – All Stroke at 30 Days (VI Population)
Note: As part of a pre-specified hiearchy, the hypothesis for this endpoint was tested using a hierarchical
gatekeeping approach. The confidence interval shown here was not adjusted for multiplicity per the
gatekeeping approach.
Adverse Events
The key CEC-adjudicated adverse events through 1 year for the EP population are presented in Table 22.
Table 22: CEC-Adjudicated Adverse Events through 1 Year
(EP Population)
Events
SAPIEN 3 Valve
PIIA-SAVR
Overall TF Only Non-TF Only
7 Days
Acute kidney injury: Stage III 5/1074 (0.5%) 3/948 (0.3%) 2/126 (1.6%) N/A
30 Days
Death 12/1074 (1.1%) 10/948(1.1%) 2/126 (1.6%) 35/938 (3.7%)
Cardiac death 10/1074 (0.9%) 9/948 (0.9%) 1/126 (0.8%) 26/938 (2.8%)
Non-cardiac death 2/1074 (0.2%) 1/948 (0.1%) 1/126 (0.8%) 9/938 (1.0%)
Stroke 29/1074 (2.7%) 24/948 (2.5%) 5/126 (4.0%) 57/938 (6.1%)
Major (disabling) stroke 11/1074 (1.0%) 7/948 (0.7%) 4/126 (3.2%) 41/938 (4.4%)
 Loading...


