42
Baseline
30 days
1 year
227.7 ± 134.7
230.6 ± 133.6 202.8 ± 142.1 219.2 ±
Plus–minus values are means ± SD.
Length of Stay (LoS)
The results for LoS are presented in Table 25. Overall, the SAPIEN 3 patients had shorter LoS'
than the PIIA-SAVR patients.
Table 25: Length of Stay (EP Population)
Length of
Stay (days)
PIIA-SAVR
Plus–minus values are means ± SD.
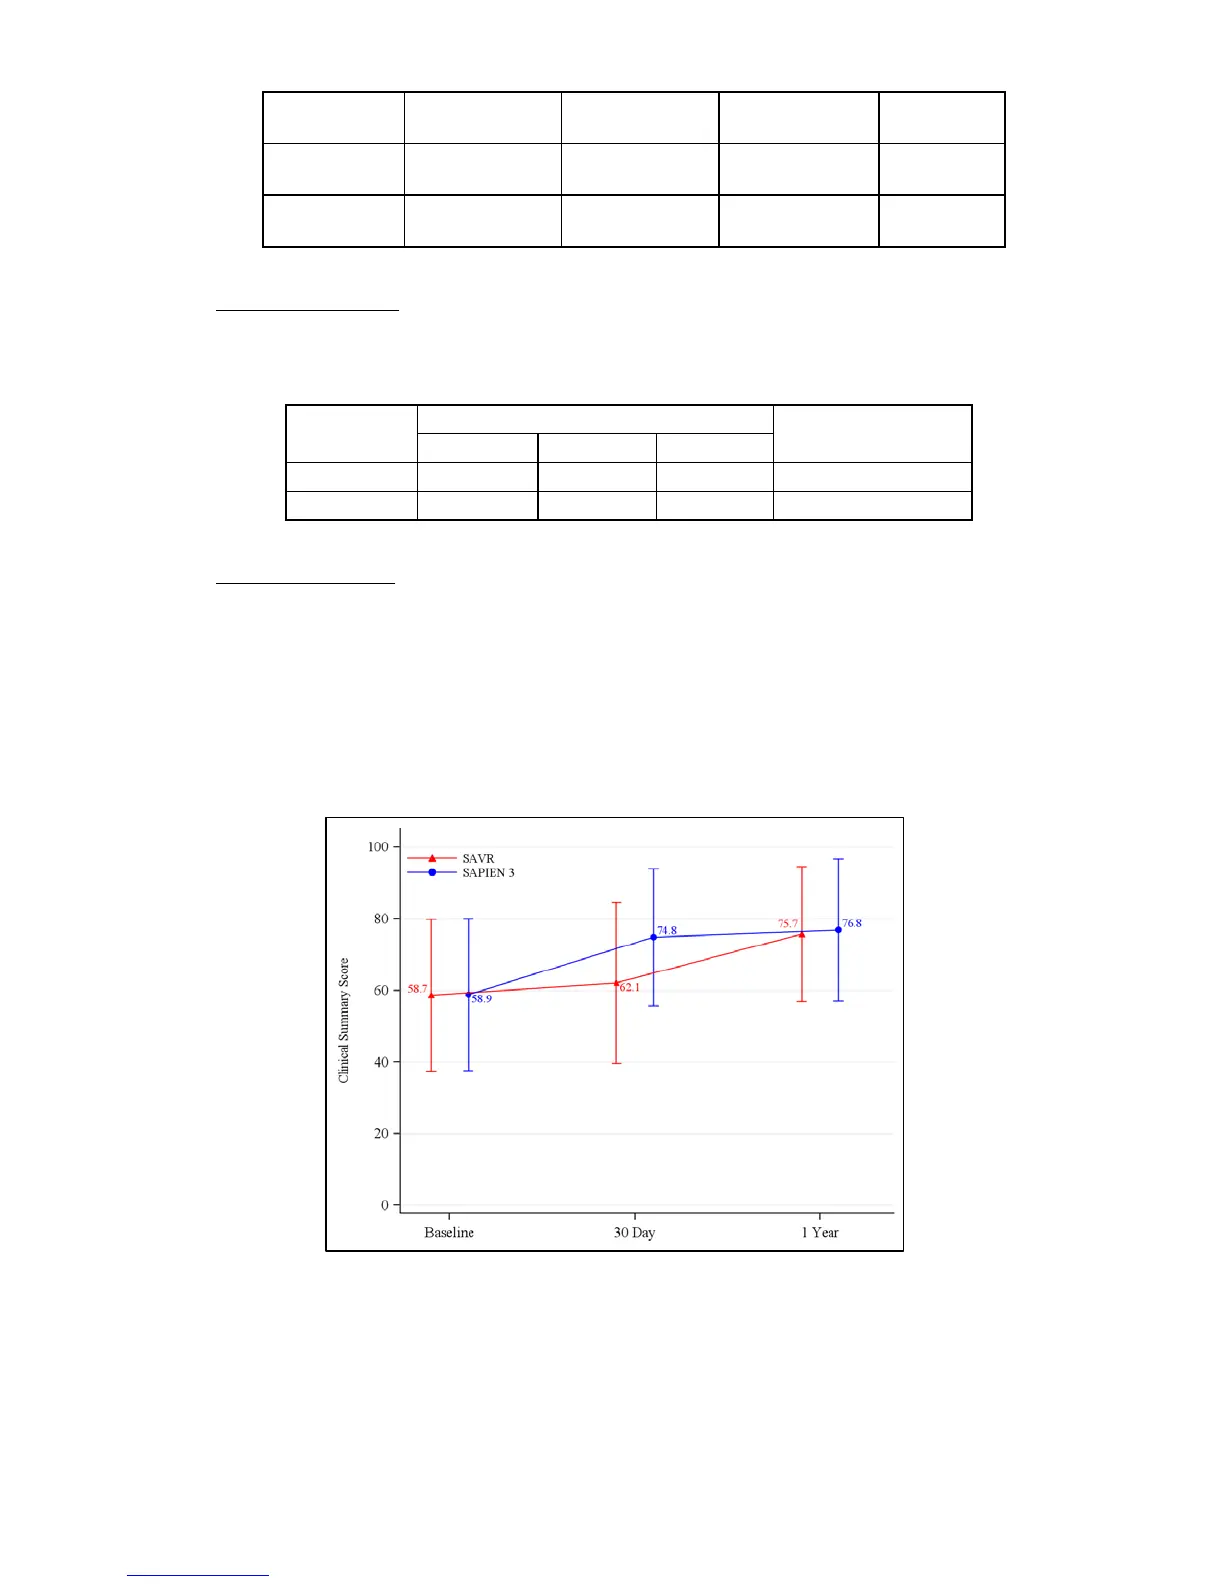
Quality of Life (QoL)
The QoL measurements using the Kansas City Cardiomyopathy Questionnaire (KCCQ) clinical
summary score are presented in Figure 31. Except for self-efficacy which showed a small
improvement, moderate to large improvements were observed in all other subscores at 30 days
and were sustained at 1 year in the PIIS3i EP population. A side-by-side comparison of the
results by access approach is presented in Figure 32. In general, improvements in the TF group
were slightly larger as compared to those observed in the Non-TF group.
Figure 31: KCCQ Clinical Summary Score (EP Population)

 Loading...


