26
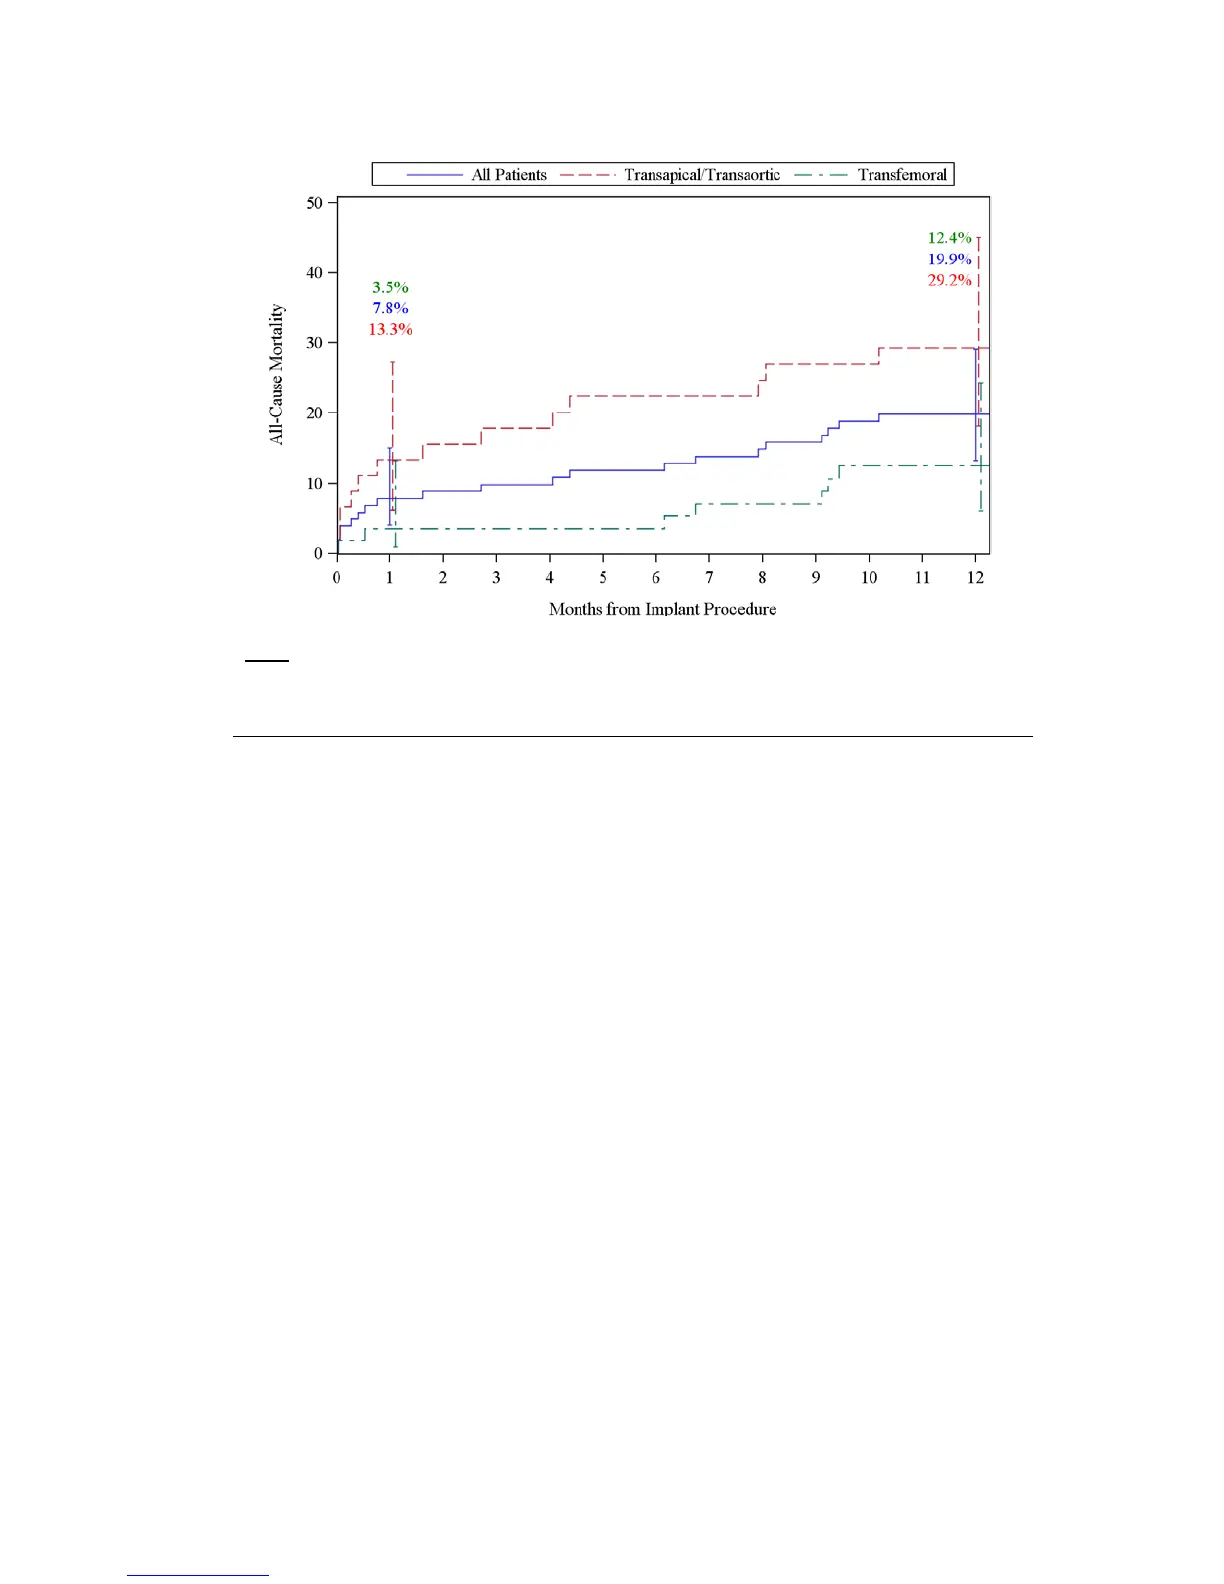
All-Cause Mortality at 1 Year
Note: The confidence intervals are calculated without multiplicity adjustment. The
adjusted confidence intervals could be wider than presented here. As such, confidence
intervals are provided to illustrate the variability only and should not be used to draw
any statistical conclusion.
The K-M estimates for the stroke rate for all patients, the TF patients, and the TA/TAo patients are
shown in Figure 12.
 Loading...


