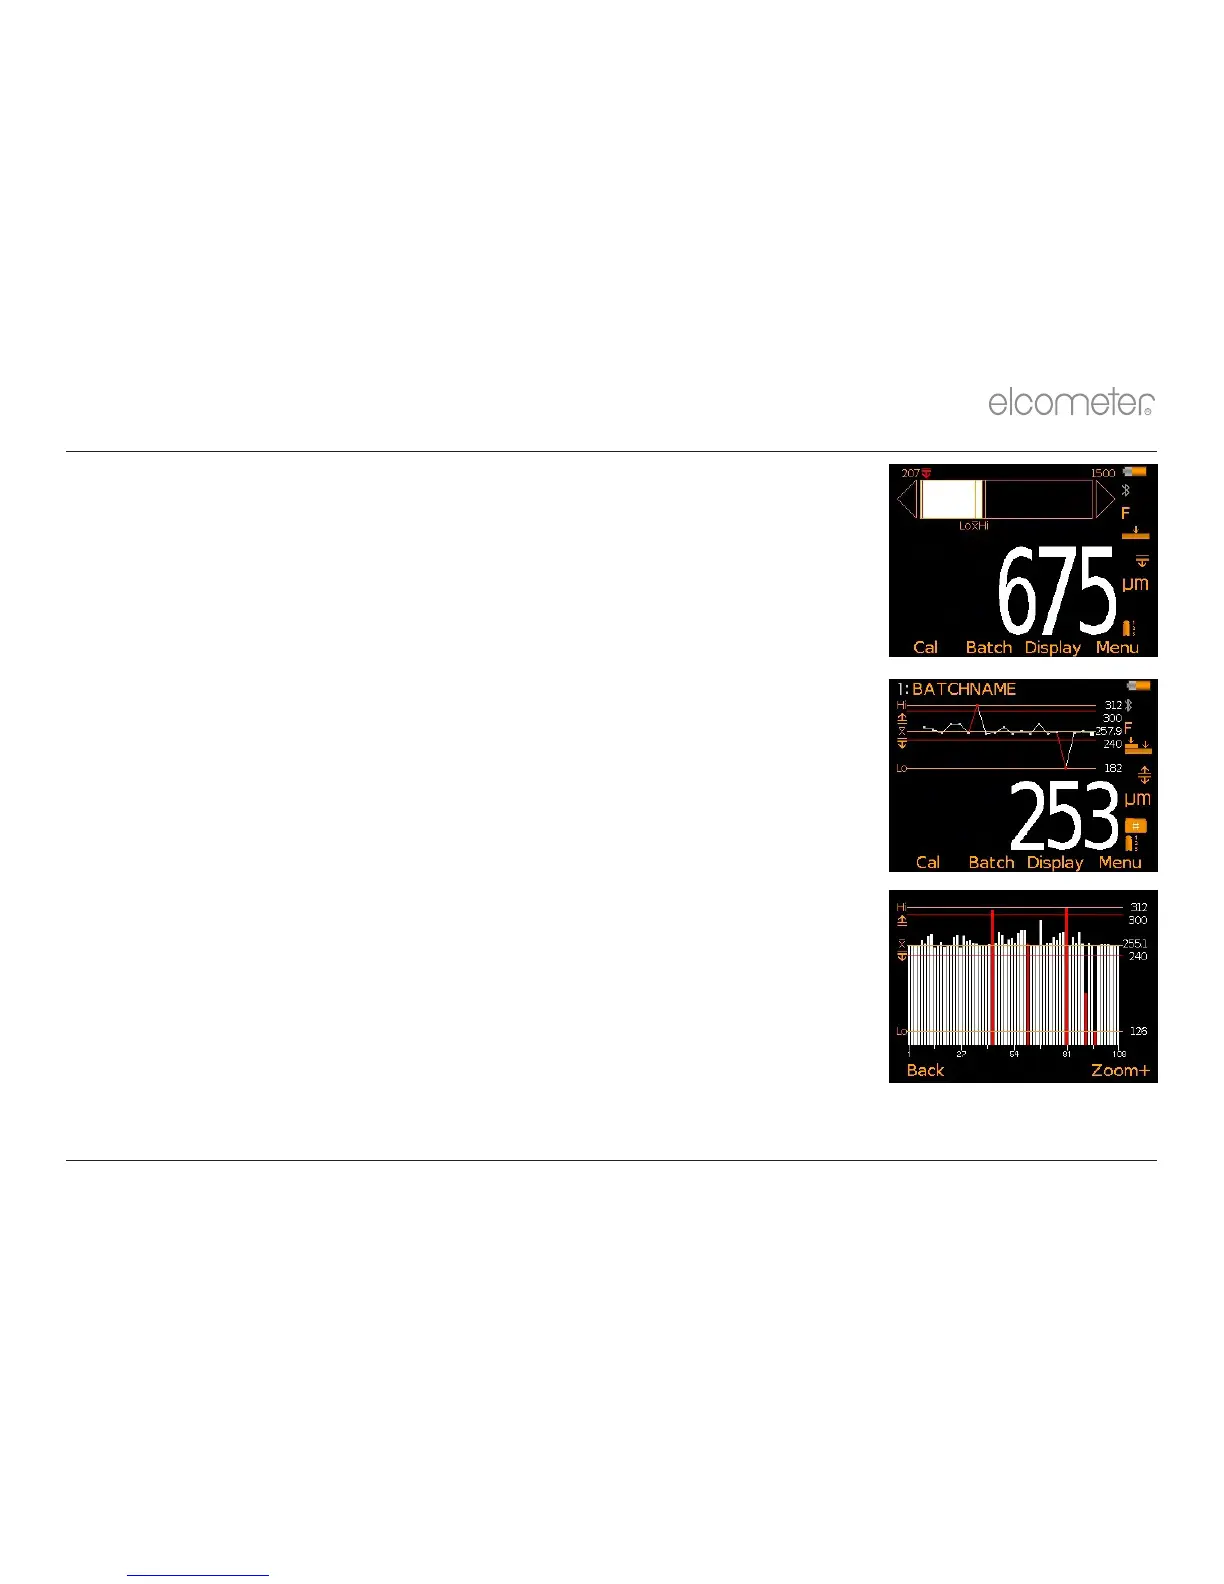
11.1 BAR GRAPH (MODEL B, S, T)
The Bar Graph displays an analogue representation of the
thickness value together with the highest, lowest and average
reading as measurements are taken. To display the Bar Graph:
1 Press the Display softkey and select “Readings & Bar Graph”
4 If a reading is outside set limits, the white bar and the reading
value turn red.
4 When in “Scan” Mode (Model T), the bar graph is
automatically displayed during each scan.
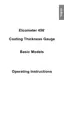
11.2 RUN CHART (MODEL S & T)
To display the Run Chart of the last 20 readings:
1 Press the Batch softkey
2 Select “New Batch” or “Open Existing Batch”
3 Press the Display softkey and select “Readings & Run Chart”
4 Red points signify a reading outside the batch’s limits (if set)
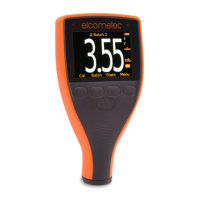
11.3 BATCH GRAPH (MODEL T)
To display the Batch Graph:
1 Select the appropriate batch name from Batch/Review Batch
2 Select “Batch Graph”
4 Red columns signify a reading outside the batch’s limits (if set)
4 Press the Zoom+ softkey followed by ç or è to review individual readings as required
11 DISPLAYING GRAPHS
www.elcometer.com 10
en
R