d = 10,2 mm
D = 16,0 mm
This gives β = 10,2/16,00
⇒ β = 0,6375 and (1-β
2
) = 0.594
Furthermore, in order to use this β−value in the above formula, we need to de-
termine the ∆ρ
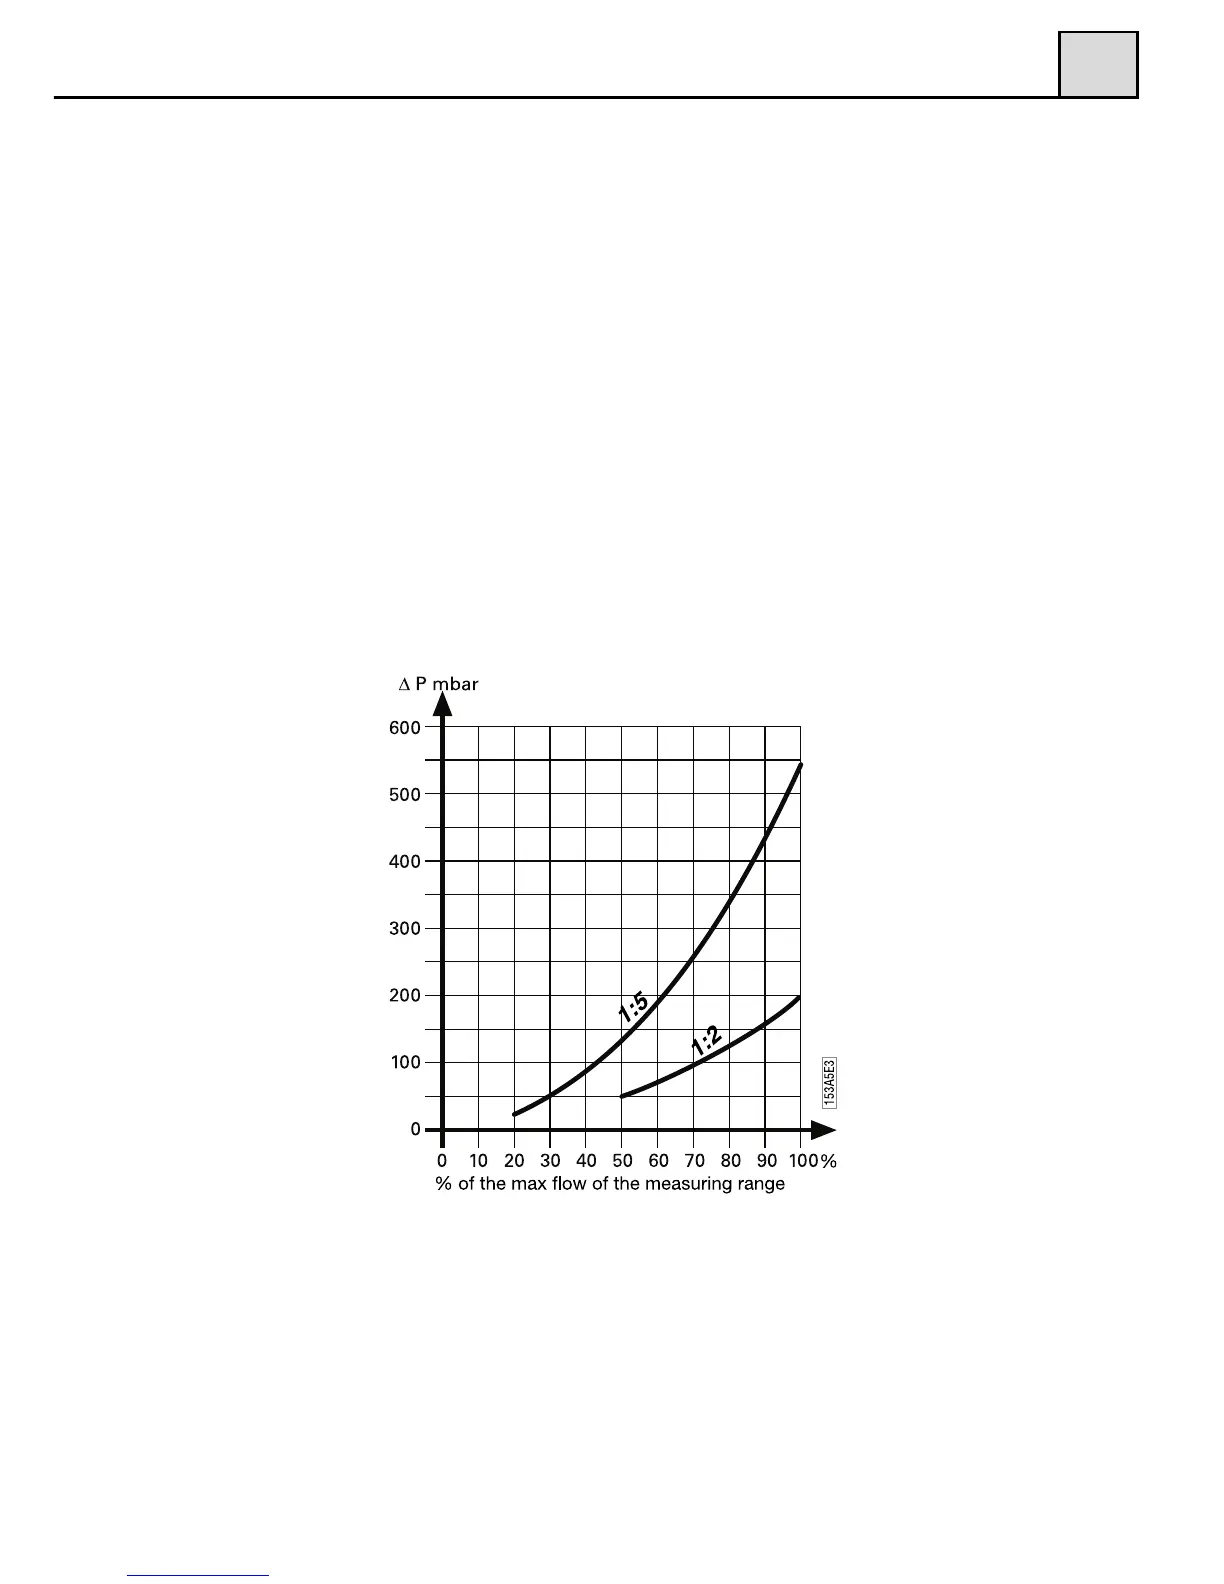
(apd). We can either use the ”Actual Pressure Drop Graph” (fig.
4)
for an approximate value or for intermediate values we can use the formula
below the graph (fig. 4). If we use the formula for calculate the ∆ρ
(apd) at 15
l/min we will get;
∆ρ
(apd) = (15/20) • 200 mbar ⇒ 112,5 mbar
In order to finally get the permanent pressure drop, we use the above descri-
bed formula: ∆ρ
(ppd) = ∆ρ(apd) • (1-β
2
)and put in the values we have:
∆ρ
(ppd) = 112,5 • 0,594 mbar ⇒ 66,82 mbar
∆ρ
(apd) = (Q/Qmax)
2
* 2000 mmH2O (196 mbar) for turn down ratio of 1:2
or
∆ρ
(apd) = (Q/Qmax)
2
* 5500 mmH2O (539 mbar) for turn down ratio of 1:5
Q = actual flow
Q
max = maximum flow of the Flow Monitor (according to the
installed orifice plate)
The Pressure loss curves in the graph (fig. 4) must serve as a guideline.