Graphics Information
C-9
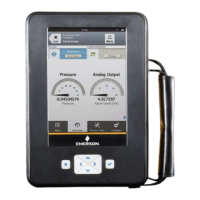
Gauge charts
A gauge chart formats device data into a view similar to
an analog car speedometer and plots device data
varying with time. The command bar shows the back
arrow icon, HART heartbeat or fieldbus logo, LAS
indicator (fieldbus devices only), ScratchPad icon, and
terminate icon.The tag bar shows the device type and
device tag.
The HELP softkey appears if there is help associated
with the particular selection. Use the buttons to pan,
zoom, and reset the chart. Use the left arrow button on
the 375 Field Communicator or the back arrow icon on
the screen to close the chart view and return to the
previous menu.
Use the drop-down menu to select the variable you want
to display. Additional gauge needles may be present if
more than one variable shares the same axis as the
selected variable. The selected variable from the
drop-down menu appears as a long, dark needle while
the other variables appear as short, light grey needles.
There can only be a maximum number of three variables
per gauge chart. The values, labels, and axis displayed
are determined by the device manufacturer.
The chart update rate is determined by the device
manufacturer. The default chart update rate is 1 second.
Figure C-6. Gauge chart example