Controls and lnd;cators
3-5
3.3
3.3.1
100
90
60
70
60
50
40
30
20
10
n
PV % SP
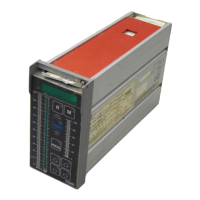
Bargraph Displays
Process Values
The process value bargraph displays the process value or any
deviation alarm limits which may have been set. The two types of
alarm limits are high/low and deviation alarms. Only one type may be
present at a time.
High/low alarms are indicated by a brighter bar for each alarm
setting. A maximum of two alarm points may be set. The upper and
lower bright bars indicate the high-high and low-low alarms. If the
alarm points are separated by less than 2.5%, only one bar is
shown.
Deviation alarms are shown in the same manner as high/low alarms.
The alarm limits however, are set relative to the setpoint and change
when the setpoint changes. If the alarm limits are separated by less
than 2.5%, only one bar is shown.
The display at the left indicates a PV low setpoint deviation alarm of
25%. The display at the right indicates PV alarms set at 82 and 50%.
Setpoint
The setpoint bargraph normally displays the setpoint value. If the
point ramp is in operation, the setpoint final value is shown as a
brighter bar during the ramp operation period.
In the display shown, the final operator set ramped setpoint is 87%,
while the current setpoint is 75%.
Output Signal
The reading of the output signal display is dependent on the mode of
operation selected.
May 1991
lJM6.1:DPR900:9102