Power Recorder
Verification Tests
9
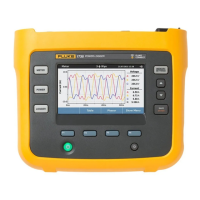
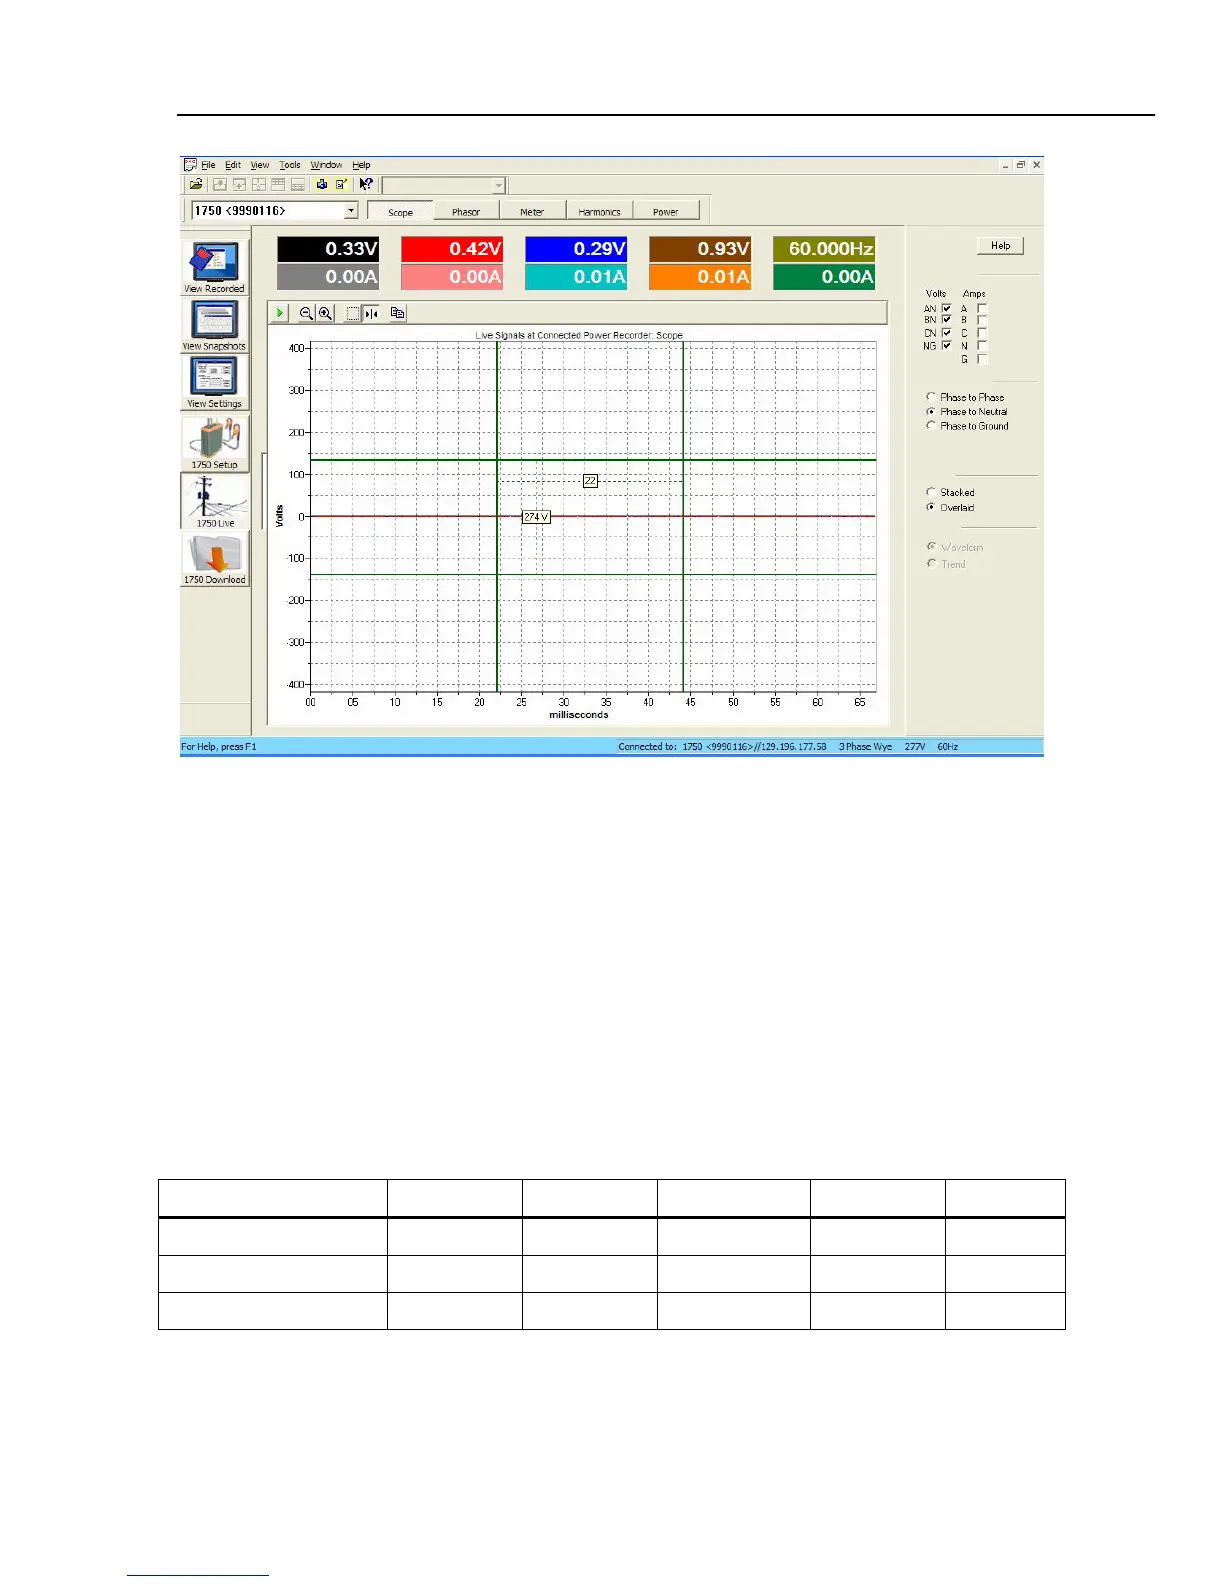
power analyze live view screen.bmp
Figure 1. Power View Software Live View
7. Connect the calibrator NORMAL HI to inputs A, B, C, and J of the Recorder.
8. Connect the NORMAL LO to input N and the protective conductor terminal . of
the Recorder.
9. Apply the voltages from Table 4 and list the Recorder readings for channels AN, BN,
CN, and NG in the appropriate areas. Sine waves will be displayed for AN, BN and
CN, all at the same amplitude and phase shift. NG will be inverted.
Note
If the voltage goes over scale, right click on the voltage scale on the left
margin of the graphical display, then click on the Zoom to Fit box to
resize.
Table 4. AC Voltage Accuracy Verification
Applied AN Reading BN Reading CN Reading NG Reading Limits
60 Vrms @ Local Hz ± 1.12 V
240 Vrms @ Local Hz ± 1.48 V
600 Vrms @ Local Hz ± 2.20 V
10. Verify that A, B, C, and J LEDs are on. N should be off.
11. Set the calibrator to STBY.
12. Verify that A, B, C, and J LEDs are off.
 Loading...