Fluke 434/435
Users Manual
18-4
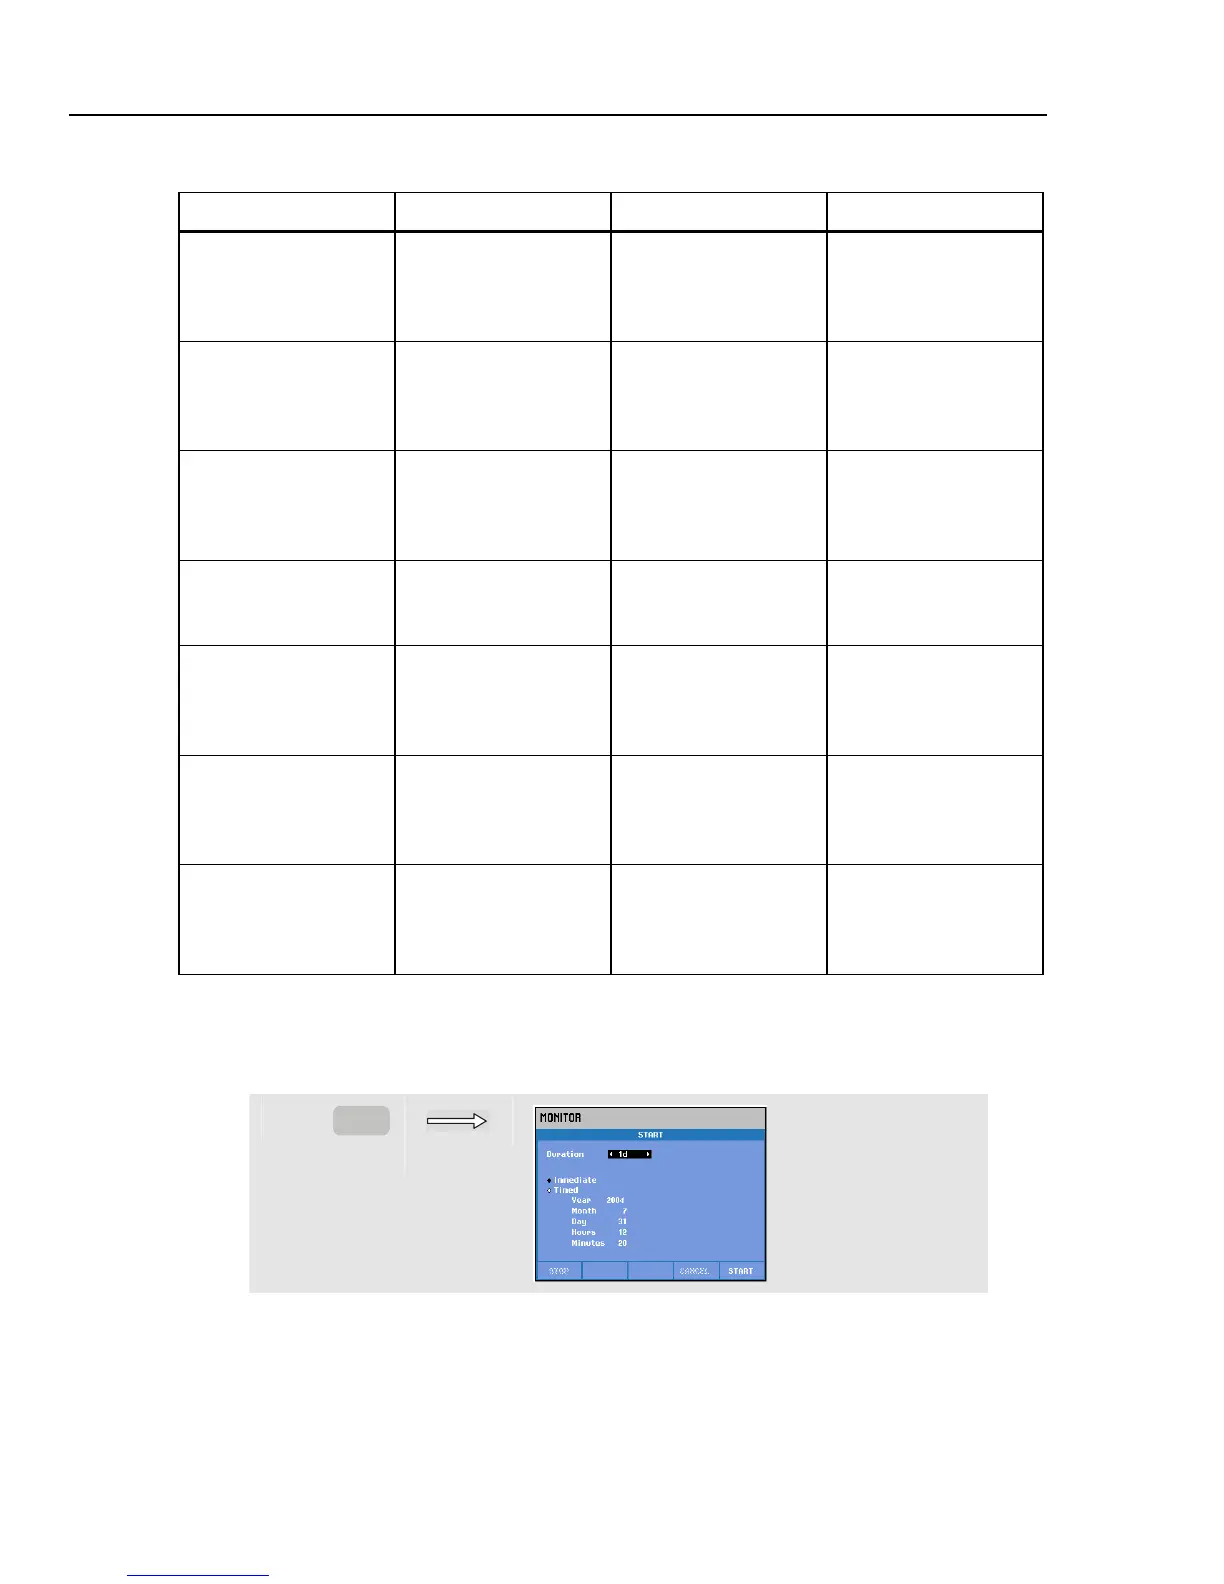
The table below gives a survey of the aspects of Power Quality Monitoring:
Parameter Available Bar Graphs Limits Averaging Interval
V rms 3, one for each phase Probability 100 %: upper
& lower limit
Probability x %: upper &
lower limit
10 minutes
Harmonics 3, one for each phase Probability 100 %: upper
limit
Probability x %: upper
limit
10 minutes
Flicker 3, one for each phase Probability 100 %: upper
limit
Probability x %: upper
limit
2 Hrs.
Dips/Interruptions/Rapid
Voltage Changes/Swells
4, one for each
parameter covering all 3
phases
allowed number of
events per week
½ cycle rms based
Unbalance 1, covering all 3 phases Probability 100 %: upper
limit
Probability x %: upper
limit
10 minutes
Frequency 1, covering all 3 phases
Measured on Reference
Voltage Input A/L1
* Probability 100 %:
upper & lower limit
Probability x %:
upper & lower limit
10 sec.
Mains Signaling 6, one for each phase,
for freq 1 and freq 2
* Probability 100 %
upper limit: N/A
Probability x %:
upper limit: adjustable
3 sec. rms
Power Quality Main Screen
To access the Power Quality Main screen:
c
MONITOR