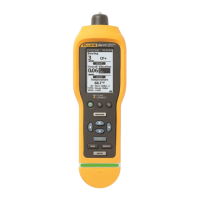
Vibration Meter
Export Data
39
The Graph Configuration Window opens. See
Figure 9.
gqi205.bmp
Figure 9. Plot Options
7. Click each drop-down list to select the Machine
Configuration from the saved measurement data:
• Machine Categories
• Machine Name
• Select Secondary Name
8. Click the drop-down list for the ISO Standard and
class.
9. Click each drop-down list to select the Graph Axis
& Unit Selection for the plot:
• X-axis required Parameters
• X-axis required Units
• Y-axis required Parameters
• Y-axis required Units
• Option for a secondary Y-axis (shows on the
right side of the graph)
• Option to show the Fluke Overall Vibration
Severity Scale
10. Click Plot Graph.
Figure 10 is an example of a graph you can make
with measurement data from the Meter.
gqi206.bmp
Figure 10. Data Plot Graph