15
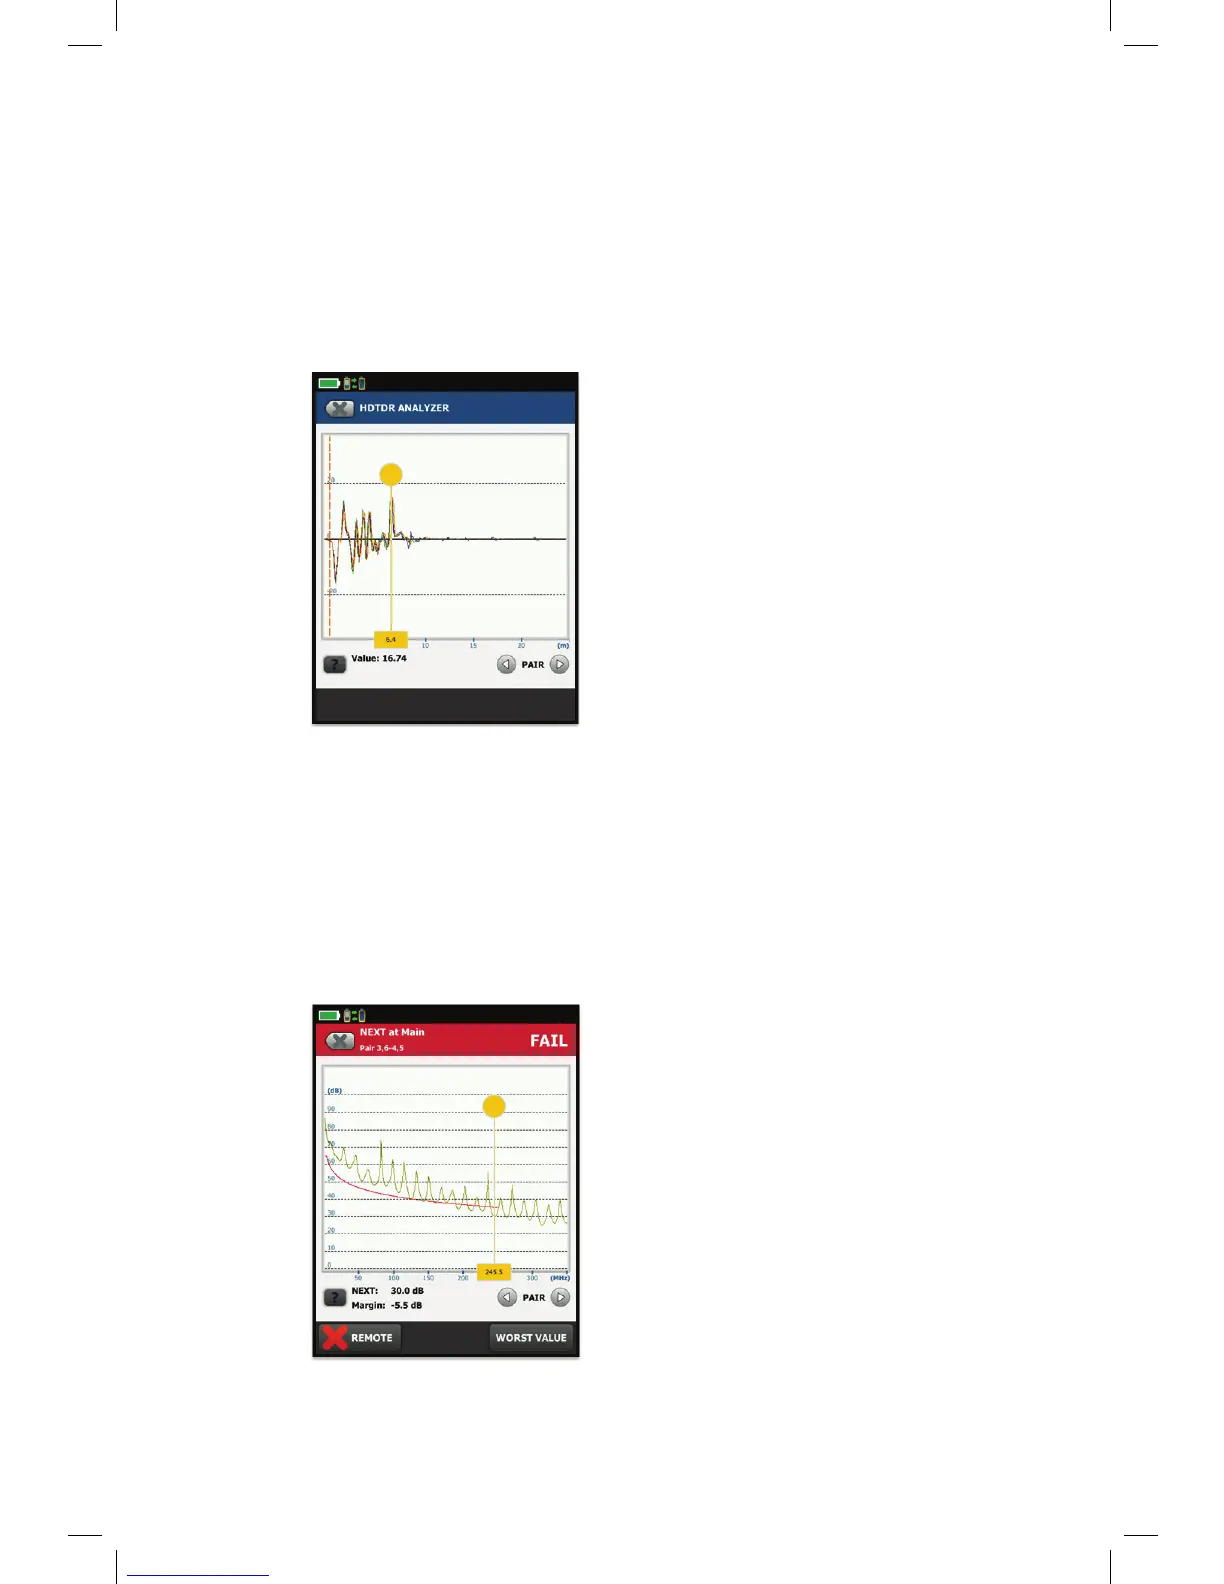
Figure 10
The HTDR analysis shows Return Loss at
the beginning of the cable for all four
pairs, usually a characteristic of water
in the cable.
HDTDX diagnostics
In gure 11, we see a NEXT (near end crosstalk) failure. Once again we identify the worst
case pair. In this case is 3,6-4,5. If we examine the NEXT graph we see the worst case
NEXT is 30.0 dB with -5.5 dB margin at 245.5 MHz. So let’s do the HDTDX diagnostic test
and view the worst pair 3,6-4,5 and seen in gure 12.
So let’s make a HDTDR diagnostic measurement on this link to see if it can tell us where
the water is. We can see the results in gure 10. The results show most of the Return
Loss is happening within the rst six meters of the cable. The rst event where the
water begins is normally in the region of 6% to 15%. In this case, we would have to
replace the cable and solve the reason for the water getting in it.
Figure 11
NEXT worst pair shows a NEXT failure of
-5.5 dB margin @ 245.5MHz on
Pair 3,6 -4,5.