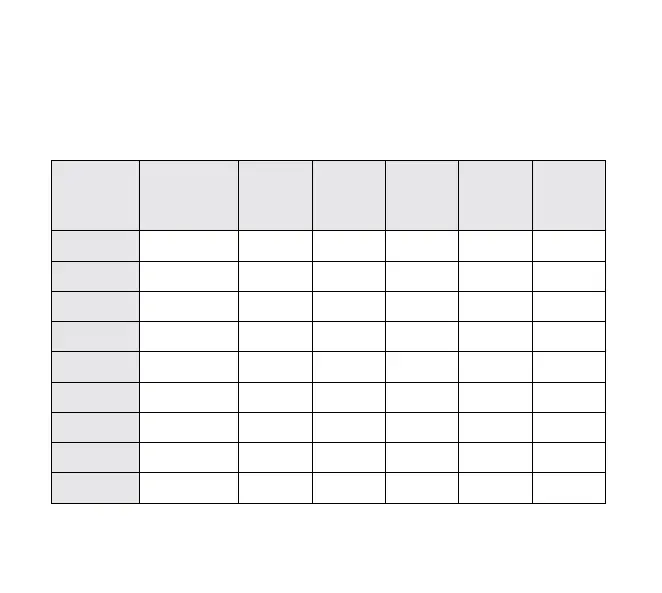
Agreement on Day 1 against YSI Reference
The accuracy of CGM versus YSI reference on the rst day of Sensor wear was assessed by calculating
the percentage of System readings that were within 15%, 20%, 30% and 40% for reference values
80 mg/dL and above, and within 15 mg/dL, 20 mg/dL, 30 mg/dL and 40 mg/dL for values below
80 mg/dL by hourly intervals. The results are presented in Table 2.
Table 2: Number and Percent of Results within YSI Reference
Time Interval
(hours)
Number of CGM-
Reference Pairs
Within
±15% /
±15mg/dL
Within
±20% /
±20mg/dL
Within
±30% /
±30mg/dL
Within
±40% /
±40mg/dL
Outside
±40% /
±40mg/dL
(0-2] * 182 77.5 87.9 95.6 99.5 0.5
(2-4] 385 71.2 83.1 94.8 98.4 1.6
(4-6] 375 77.6 86.4 91.7 96.3 3.7
(6-8] 373 78.0 87.9 97.3 99.5 0.5
(8-16]
†
106 74.5 83.0 97.2 100.0 0.0
(16-18]
303 80.2 89.1 96.7 99.7 0.3
(18-20]
344 80.2 86.6 94.8 98.8 1.2
(20-22]
336 81.3 87.8 97.9 98.8 1.2
(22-24)
155 86.5 93.5 96.1 98.7 1.3
* (0-2] interval includes the 1 hour start-up time.
† Time interval is not divided to smaller segments due to small number of data pairs.
109