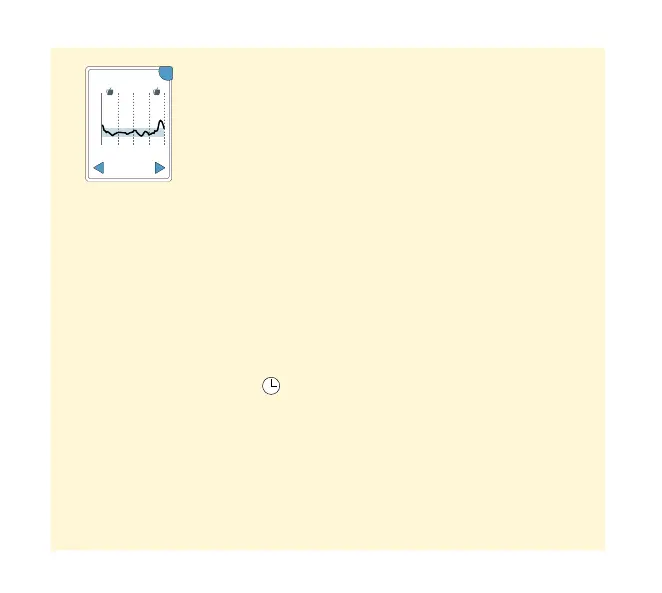
Daily Graph
A graph of your Sensor glucose readings by day.
The graph shows your Target Glucose Range and
symbols for food or rapid-acting insulin notes you
have entered.
Notes:
• While Sensor glucose readings are gathered in
the System range of 40-500 mg/dL, the Daily
Graph display range is 0-350 mg/dL for ease
of review on screen. Glucose readings above
350 mg/dL are displayed at 350 mg/dL. For
sequential readings above 350 mg/dL, a line
is displayed at 350 mg/dL.
• You might see gaps in the graph during times
when you have not scanned at least once in
8 hours.
• The symbol may appear indicating the
Reader time was changed. Gaps in the graph
may result or glucose readings may be hidden.
12
am
6
am
12
pm
6
pm
12
am
350
250
150
50
OK
Daily Graph
(mg/dL)
22 Feb
Wednesday
55