Other History Options
Use the arrows to view information about your last 7, 14, 30, or 90 days.
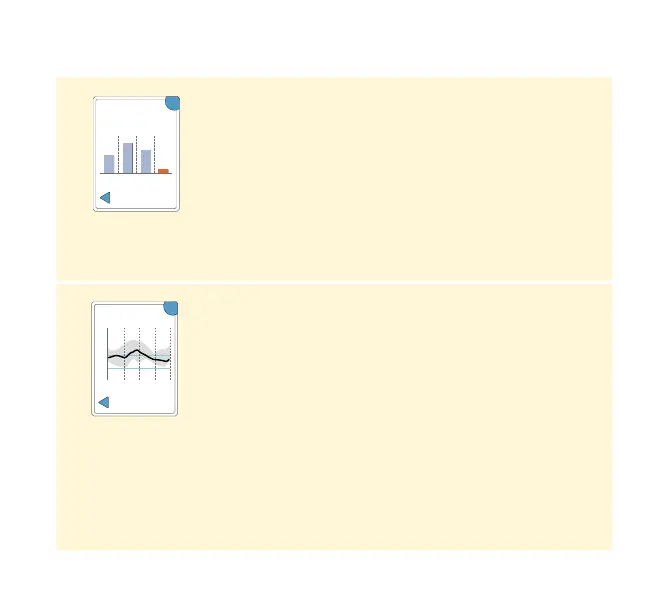
Average Glucose
Information about the average of your Sensor
glucose readings. The overall average for the time
is displayed above the graph. The average is also
shown for four dierent 6-hour periods of the day.
Readings above or below your Target Glucose
Range are orange, while readings in range are blue.
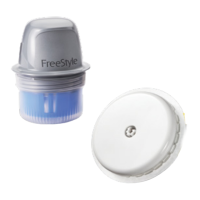
Daily Patterns
A graph showing the pattern and variability of your
Sensor glucose over a typical day. The thick black
line shows the median (midpoint) of your glucose
readings. The gray shading represents a range
(10-90 percentiles) of your Sensor readings.
Note: Daily Patterns needs at least 5 days of
glucose data.
OK
Last 7 Days
12
am am ampm pm
6 12 6 12
121
152
134
Average:
119 mg/dL
69
Average Glucose
12
am
6
am
12
pm
6
pm
12
am
350
250
150
50
OK
Daily Patterns
(mg/dL)
Last 7 Days
56