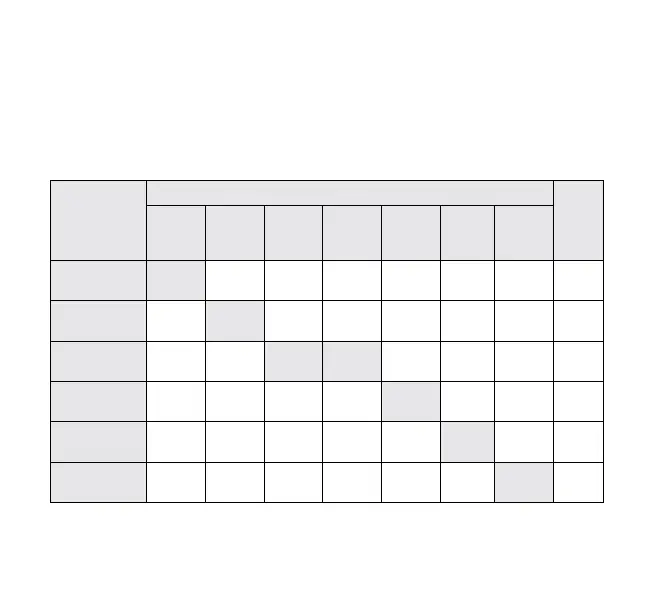
Concurrence Analysis by Glucose Trend Arrow
Trend Arrow accuracy of the System, as assessed by concurrence analysis, is presented in Table 7. For
example, in the clinical study, when the trend arrow indicated that glucose was changing slowly (-1 to
1 mg/dL/min (g) ), actual glucose levels in the body were falling quickly (i) 0.2% of the time, falling
(m) 2.6% of the time, changing slowly (g) 86.6% of the time, rising (k) 4.2% of the time, and rising
quickly (h) 0.6% of the time.
Table 7: Concurrence Analysis by Glucose Trend Arrow
CGM
(mg/dL/min)
YSI (mg/dL/min)
N
<-2 [-2, -1] [-1, 0] [0, 1] [1, 2] >2 NA*
<-2 (i)
39.9 42.7 8.4 0.7 0.0 0.0 8.4 143
-2 to -1 (m)
4.7 27.2 56.1 5.5 0.3 0.0 6.2 695
-1 to 1 (g)
0.2 2.6 50.2 36.4 4.2 0.6 5.8 7786
1 to 2 (k)
0.0 0.6 5.6 43.4 36.3 9.8 4.5 717
>2 (h)
0.0 0.0 1.6 12.6 37.2 43.3 5.3 247
NA† 0.6 8.3 27.4 37.5 13.1 4.2 8.9 168
* Glucose rate of change not available due to the time dierence between glucose readings exceeding 30 minutes.
† Glucose Trend Arrow not available.
115