13-9-663 Page 46
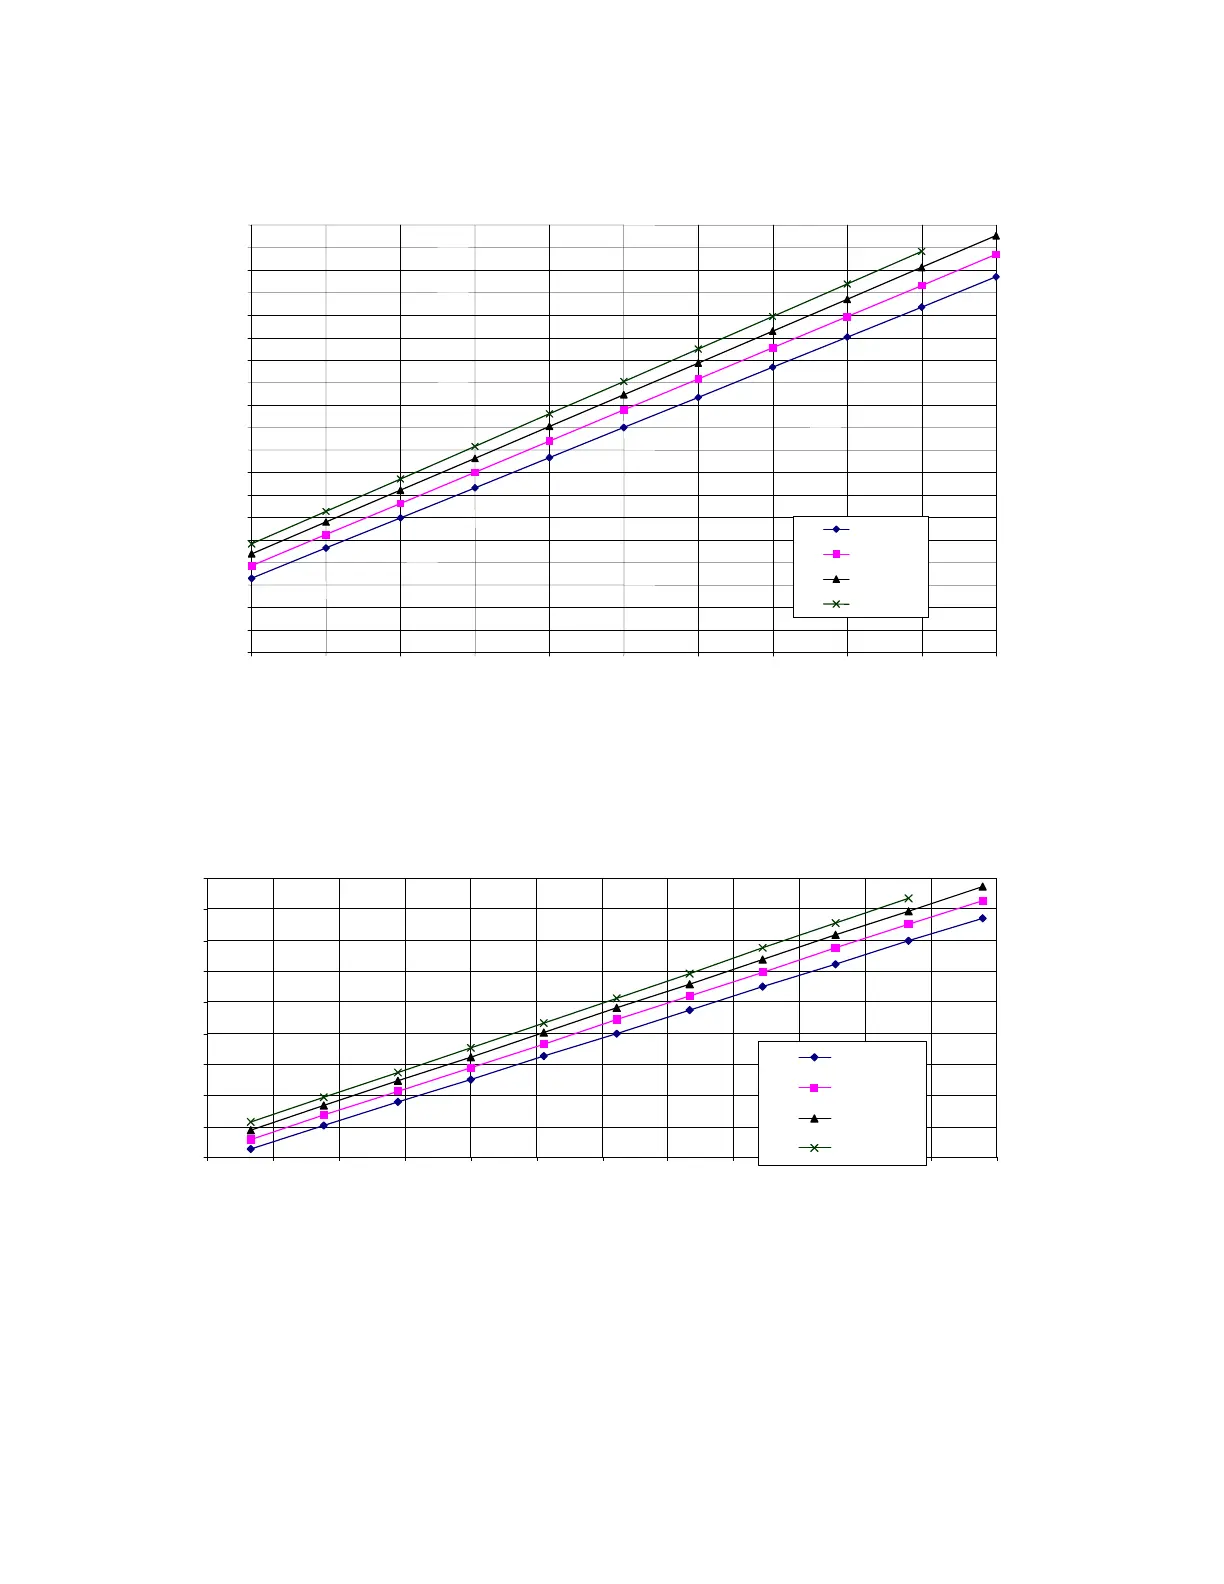
Dew-Point Temperature vs. Ambient Temperature
(100% Relative Humidity)
40
50
60
70
80
90
100
110
120
130
140
150
160
170
180
190
200
210
220
230
20 30 40 50 60 70 80 90 100 110 120
Ambient Temp. F
Dew-Point Temp. F
100 psig
125 psig
150 psig
175 psig
Figure 5-1 – DEW POINT CHART °F
Figure 5-2 – DEW POINT CHART °C
These charts are easily used by reading the ambient temperature along the bottom axis of the chart and then
reading the appropriate pressure curve to determine the corresponding dew-point temperature on the left axis
of the chart. The compressor discharge temperature must be maintained at a minimum of
10° F above this
dew-point
temperature to prevent condensation accumulation in the lubricant reservoir. These charts assume
100% relative humidity.
Dew-Point Temperature vs. Ambient Temperature
(100% Relative Humidity)
20
30
40
50
60
70
80
90
100
110
-10-5 0 5 101520253035404550
Ambient Temp. C
Dew-Point Temp. C
6.9 bar
8.6 bar
10.4 bar
12.1 bar