History Screens
15
History Screens
Electricity History
By selecting Electricty usage from
the Menu screen, you can see your
recent usage.
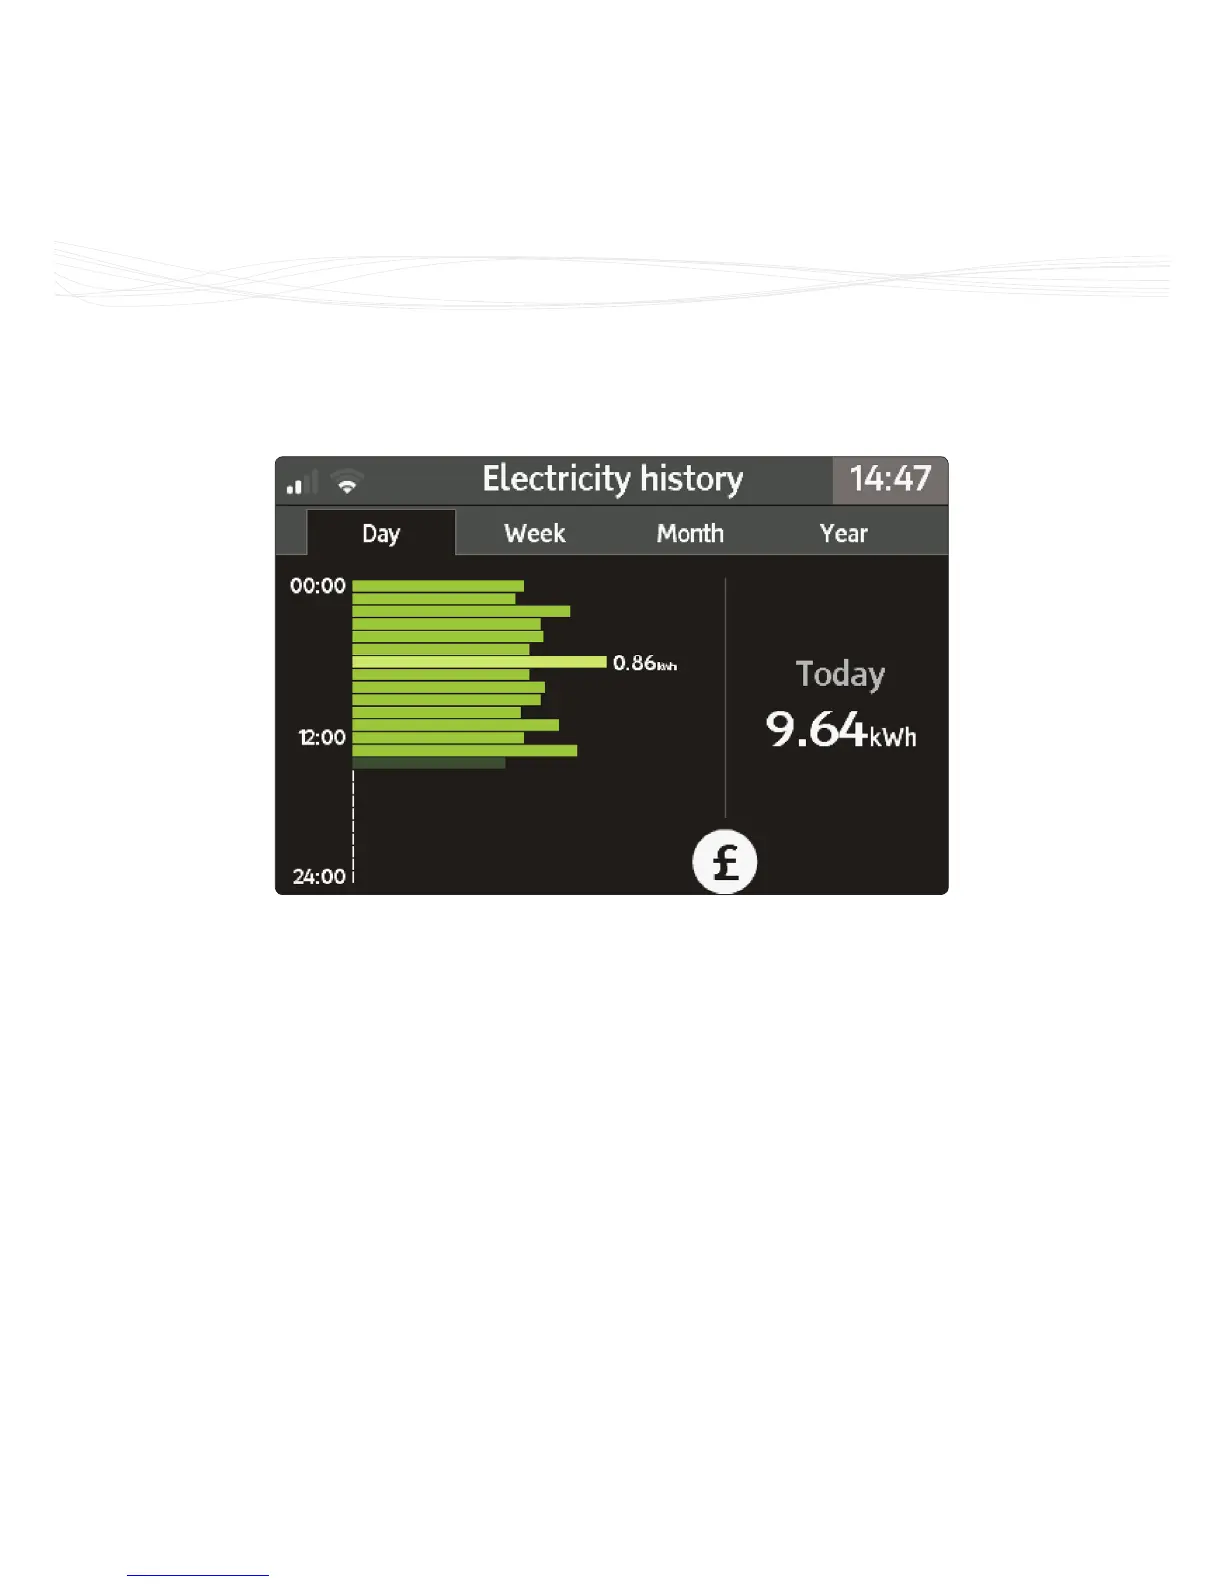
Day tab
The screen initially shows the current
usage for today in energy (kWh),
divided in to the 24 hours of the day.
Each bar represents a one hour period
and is shown in green. The lightest
green bar shows the highest hourly
period for today and the darkest
green bar shows the current hour or
incomplete period.
The highest hourly period (lighter
green) will always display the usage
for that hour, the gure is shown to
the right of the bar (0.86kWh in the
example shown above).
Pressing the w button will change
the values from being shown in cost as
£/hr and energy as kW.
The total for today is shown inclusive
of any daily standing charge. This
means at midnight the total may
be greater than £0.00, even if no
electricity has been used. The bars
exclude any daily standing charge.
 Loading...