2.8.6 Peak Power Measurements Using the Graph Mode
It is recommended that you read the basic information pertaining to the Graph Mode in Section 2.6.3 for
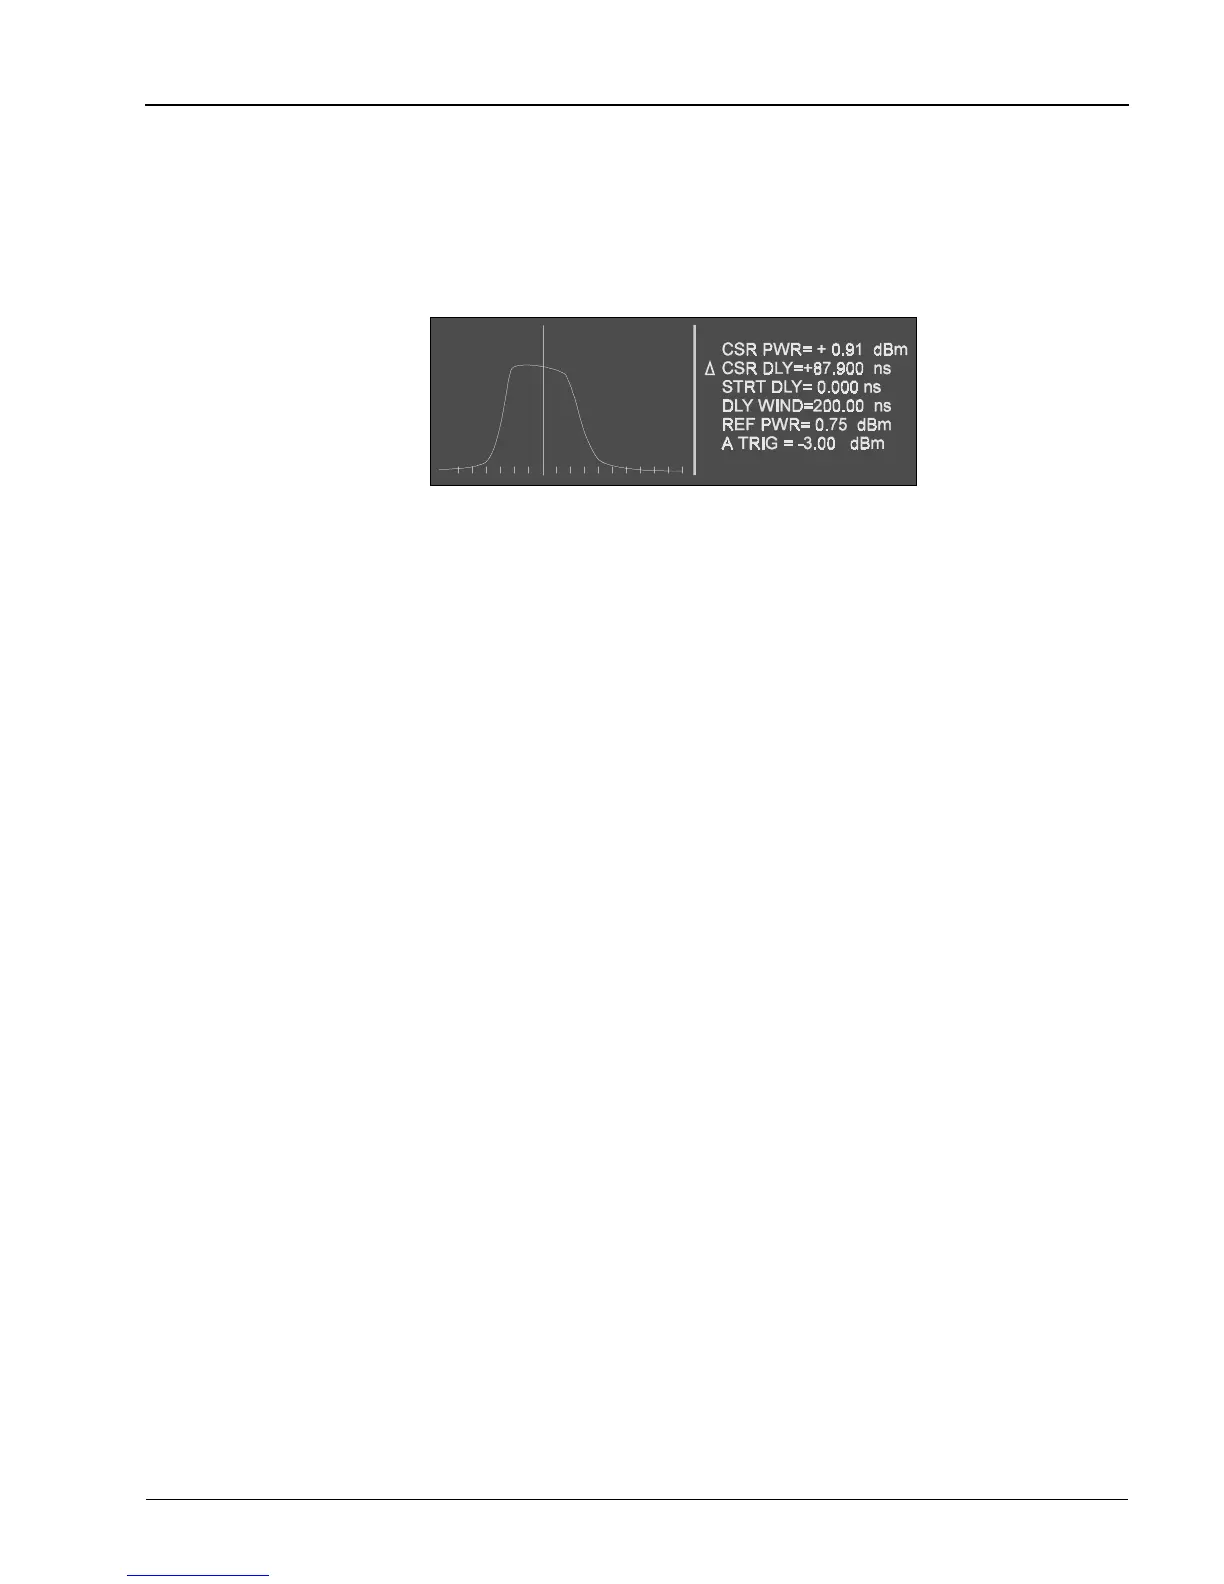
a better understanding of this function. The initial Graph Mode (Cursor sub-mode) display looks
something like that shown in Figure 2-7. Pulse profiles are shown graphically on the left side of the
display while the right side displays the power and timing parameters pertinent to the pulse.
To use the Graph Mode for peak power measurements, follow the instructions given next for accessing
the Graph Mode:
1. Connect the detector(s) to the detector connection(s) on the front panel, and allow the system to
warm up for 30 minutes. Then conduct a Self Cal as described in Section 2.7.
2. After ensuring that the pulse power of the RF source to be measured is not high enough to cause
damage to the detectors (limit to less than +20 dBm), connect the channel A detector to the
source.
3. Select the Graph Mode of operation by pressing [GRAPH]. Press [AUTOSCALE] and the PPM
will attempt to autoscale the pulse on the display. If there is no pulse present at the detector
input or if the pulse power is below -10 dBm, then the PPM will not trigger (the New Data light
will be out).
While the PPM is Autoscaling, the display will indicate Autoscaling in Progress. When autoscaling is
complete, the pulse will be centered in the graphics area of the display and the vertical cursor will be
positioned at the center of the pulse profile.
If the display does not indicate a pulse centered in the graphics area of the display with the vertical
cursor positioned at the center of the pulse profile, then the autoscaling process was not successful.
One possible reason that the PPM might not be able to autoscale is that the RF pulse might be too wide.
The default setting of the PPM for the maximum pulse width that can be autoscaled is 75 µs. If desired,
this maximum setting can be changed by pressing [MENU] (9) [F2].
2.8.7 Pulse, Cursor, and Marker Readouts
On the 8500A, the Graph display mode has been enhanced to: 1) Simplify entry of timebase, triggering,
and display scaling (CURSOR sub-mode), 2) Allow automatic readout of rise time, fall time, and pulse
width (PULSE parameter sub-mode), and 3) Allow automatic readout of time differences between custom
marker settings on the pulse (MARKER sub-mode).
These three functions can be accessed by pressing [PULSE/CURSOR/MARKER] to cycle the display
through the three sub-modes.
Figure 2-7. Typical Initial Graph Mode Display
Operation
Manual No. 20790, Rev C, November 1998
2-23
 Loading...