according to your diagnosis, which is shown in the diagnosis report.
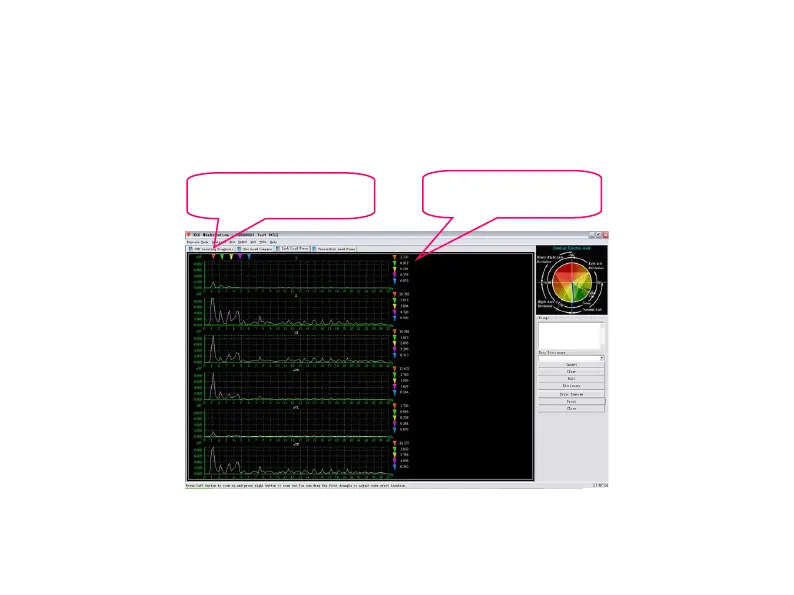
Power Spectrum Analysis, as Figure 77.
Through comparing the peaks, the power spectrum of 12 leads can help doctors to diagnose. You
can click the buttons to check limb lead power spectrum or precordial lead power spectrum.
Click "Print Preview" or "Print" to preview or print reports.
d
rag r
ed a rrowhead with mouse t o
a
lter
the position o f harmonic w ave
c
rest
which is pointed by arrowhead.
N
umbe
r is the power value of the
w
ave w
hich is pointed by t he
a
rrow
head of corresponding color.