EasyManuals Logo

Gima CONTEC 8000 User Manual

Gima CONTEC 8000
170 pages
To Next Page IconTo Next Page
To Previous Page IconTo Previous Page
Page #121 background imageLoading...
Page #121 background image
1
12
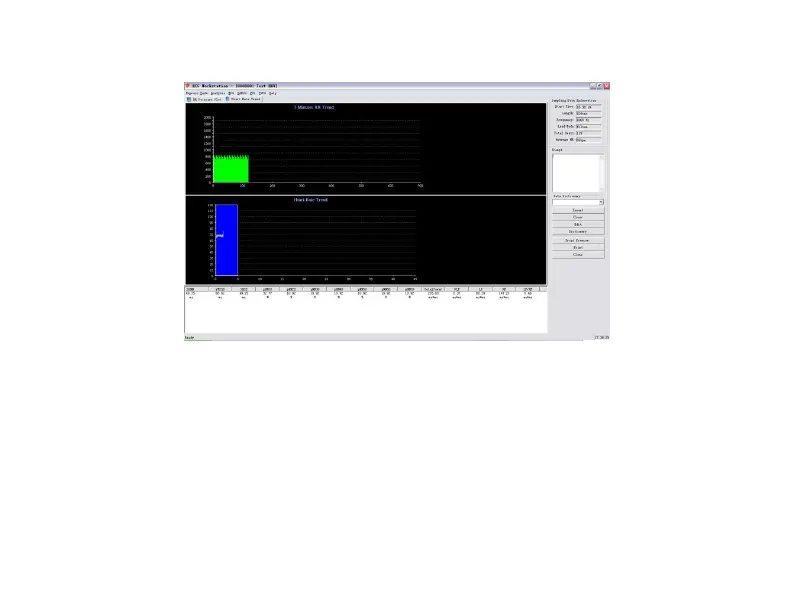
Figure 84
RR Interval Histogram is a graphic mode which reflects the distribution of the RR interval
at a period of time (such as 1 hour, 12 hours, 24 hours). The horizontal axis expresses the
R-R interval, and the vertical axis expresses the corresponding number of heartbeats. The
shape of RR Interval Histogram intuitively reflects circumstance of HRV. When the
histogram is high and narrow, it demonstrates the value of HRV is smaller than the normal.
On the contrary, the value is larger than the normal. The RR Interval Histogram has single

Questions and Answers:

Question and Answer IconNeed help?

Do you have a question about the Gima CONTEC 8000 and is the answer not in the manual?

Gima CONTEC 8000 Specifications

General IconGeneral
BrandGima
ModelCONTEC 8000
CategoryDesktop
LanguageEnglish