GSI
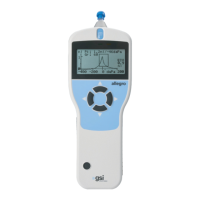
Allegro Tympanometer
User Manual
D-0120695 Rev D 2022-06 Page 21
• The Gradient, in daPa (Gr)
• The Ear Canal Volume (ECV) in ml measured at 200 daPa
• A plot of admittance against pressure
• The normalized rectangle showing the ideal location for the tympanogram peak
Review the tympanogram to ensure that the peak admittance point selected by the Allegro is
suitable. If required, it is possible to select an alternative peak using the ▲ and ▼ keys. The
figures displayed will change to reflect the peak selected and will be saved with the
tympanogram.
To repeat the test, press ◄.
When satisfied with the tympanogram press ►.
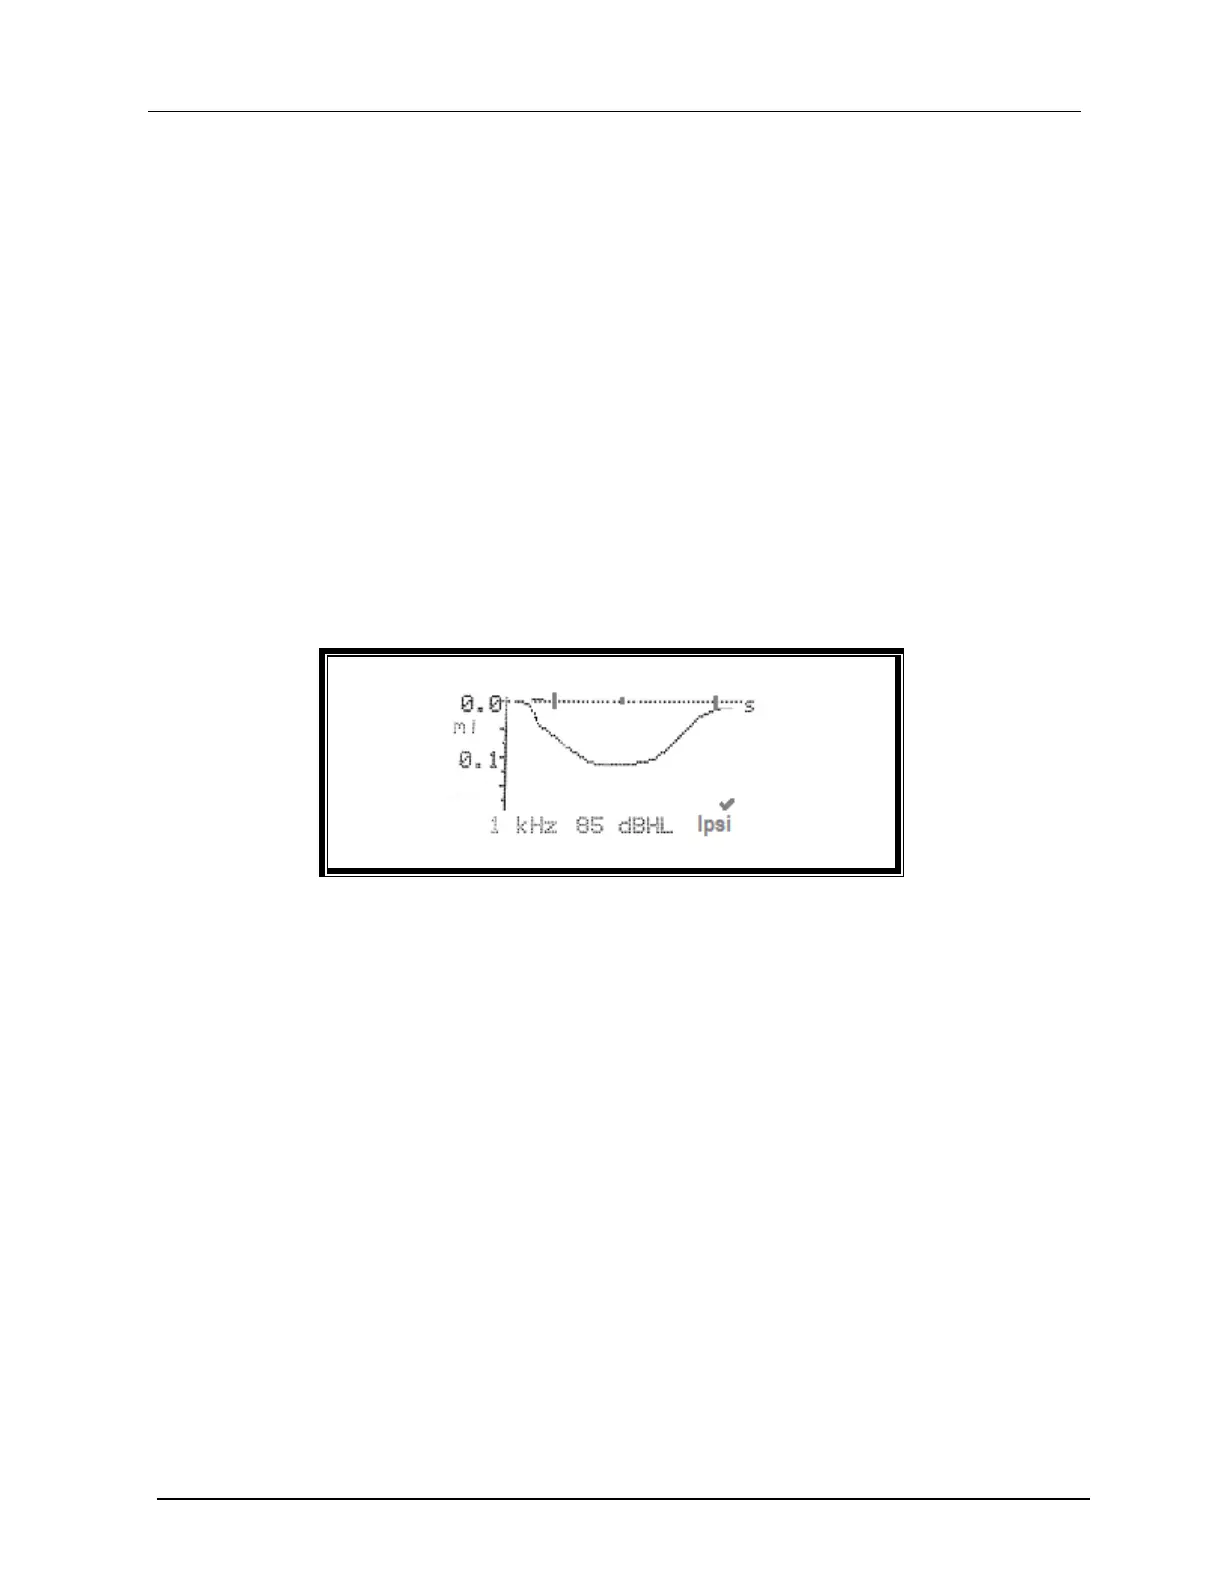
If the reflex test was carried out the results will now be displayed:
The display shows:
• The frequency of the reflex stimulus
• “” if a reflex was found, otherwise “X”
• The lowest level of tone (dBHL) at which a reflex was found
• A trace of the admittance change against time
If the reflex test was performed at a single frequency use the ▲ and ▼ keys to view the results
for each of the reflex tone levels used. If the reflex test was performed at more than one
frequency use the ▲ and ▼ keys to view the results for the other frequencies.
If the Allegro was set to test for a reflex at all levels of the stimulus (see Reflex Autostop) press
► to view an additional display following the reflex graphs. This shows a summary of the levels
and frequencies at which a reflex was detected. The dash symbol “-” is shown if a reflex tone was
not presented at the level indicated.
 Loading...