12
CONDUCTIVITY VERSUS
TEMPERATURE CHART
The conductivity of an aqueous solution is a measure of its ability to carry
an electrical current by means of ionic motion.
The conductivity invariably increases with increasing temperature.
It is affected by the type and number of ions in the solutions and by
the viscosity of the solution itself. Both parameters are temperature
dependent. The dependency of conductivity on temperature is
expressed as a relative change per Celsius degrees at a particular
temperature, commonly as %/ºC.
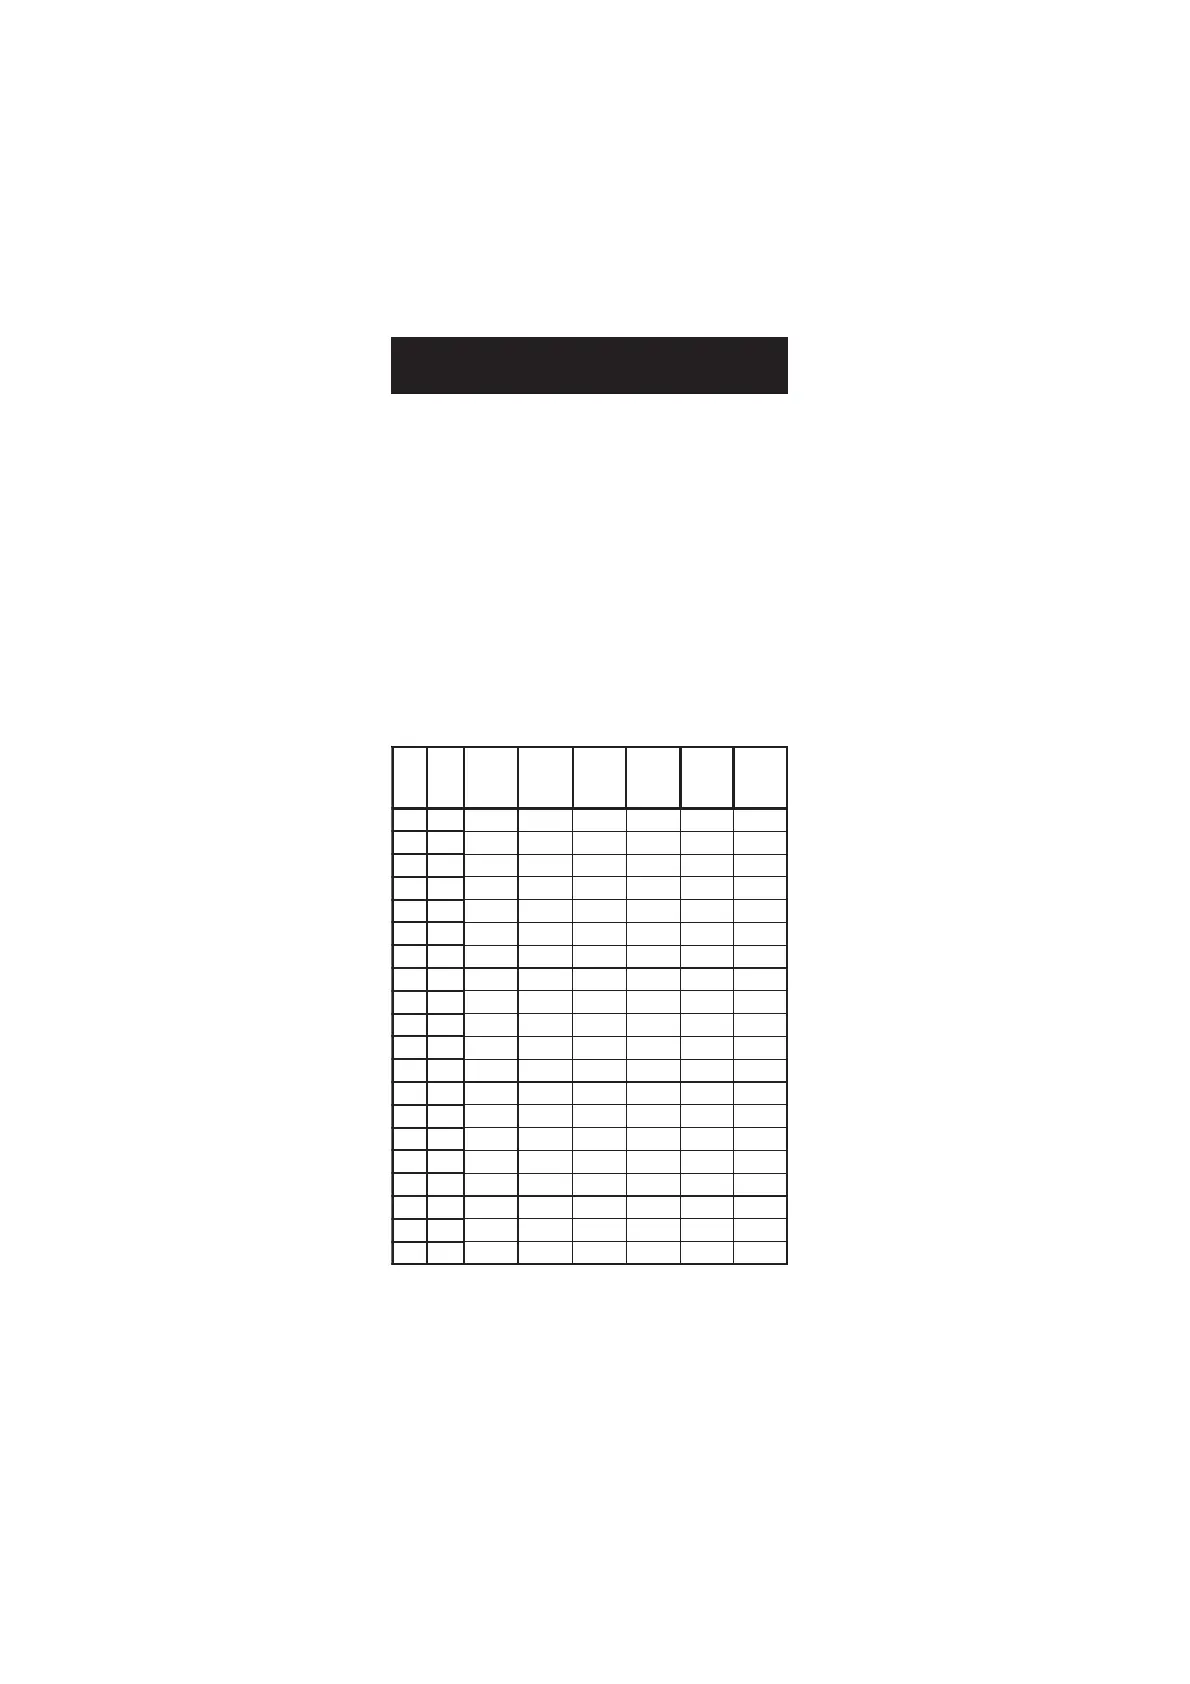
The following table lists the temperature dependence of HANNA EC
calibration standards.
Cº Fº
0307IH
0308IH
(
µ )mc/S
1307IH
1308IH
(
µ )mc/S
3307IH
3308IH
(
µ )mc/S
4307IH
4308IH
(
µ )mc/S
5307IH
5308IH
(
µ )mc/S
9307IH
9308IH
(
µ )mc/S
0 23 0517 677 46 00384 00456 0672
5 14 0228 698 56 00535 00147 0813
01 05 0339 0201 76 00695 00238 5163
51 95 08401 7411 86 00456 00529 3604
61 8.06 02701 3711 07 00276 00449 5514
71 6.26 05901 9911 17 00586 00369 5424
81 4.46 09111 5221 37 00896 00289 7334
91 2.66 03411 1521 47 00317 002001 9244
02 86 07611 8721 67 00427 001201 3254
12 8.96 01911 5031 87 00047 000401 7164
22 6.17 05121 2331 97 00257 009501 1174
32 4.37 09321 9531 18 00567 009701 5084
42 2.57 04621 6831 28 00387 008901 2094
52 77 08821 3141 48 00008 008111 0005
62 8.87 03131 0441 68 00318 008311 6905
72 6.08 07331 7641 78 00038 007511 0915
82 4.28 02631 4941 98 00948 007711 6825
92 2.48 07831 1251 09 00368 007911 3835
03 68 02141 8451 29 00288 008121 9745
13 8.78 07341 5751 49 00009 009321 5755
 Loading...