27 - 60
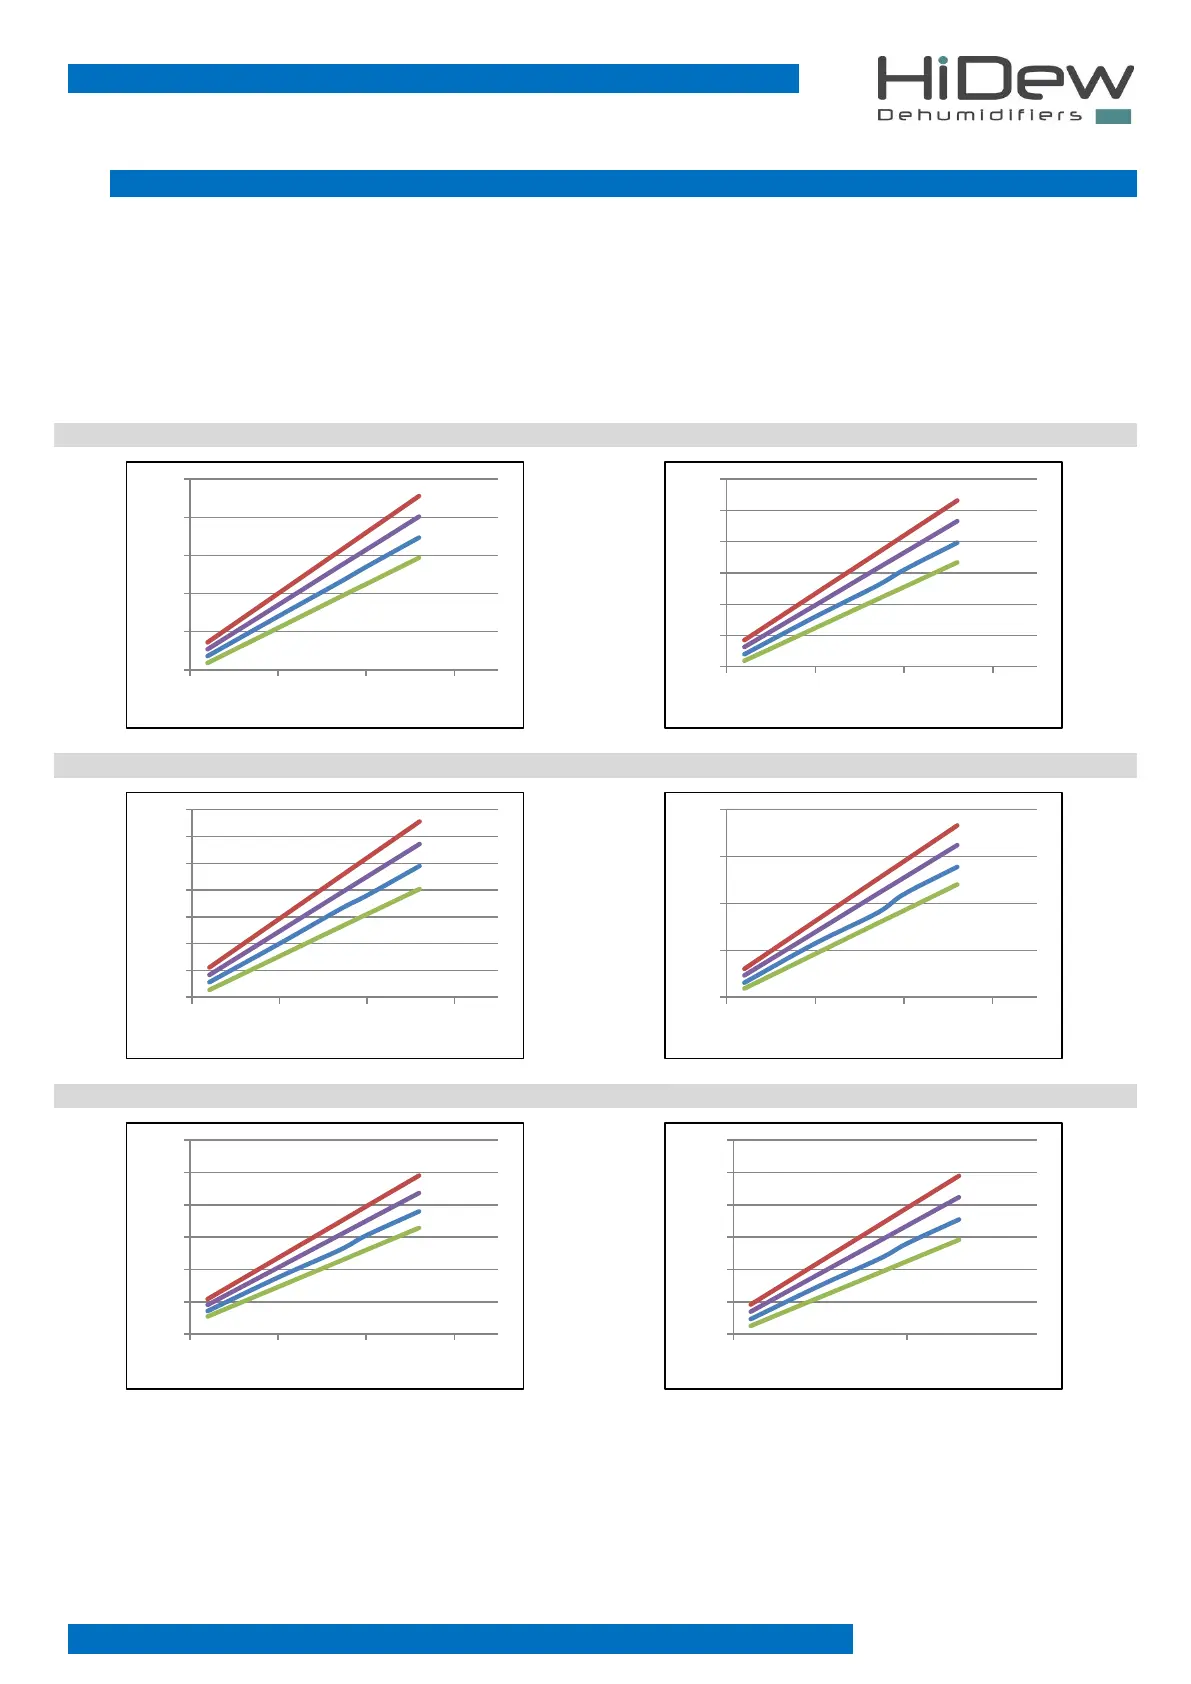
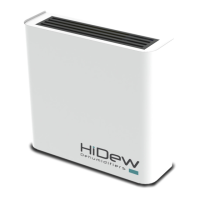
4.4 PERFORMANCE CURVES
The temperature is shown on the bottom axis.
The dehumidification capacity is indicated on the left axis.
To calculate the dehumidification capacity at a specific work point:
- Assume a position on the lower axis at ambient temperature
- Ascent until crossing the ambient humidity curve
- Move to the left and read the dehumidification capacity at that work point
40 50
60 70
90 100