Digital Video Recorder User Manual
194
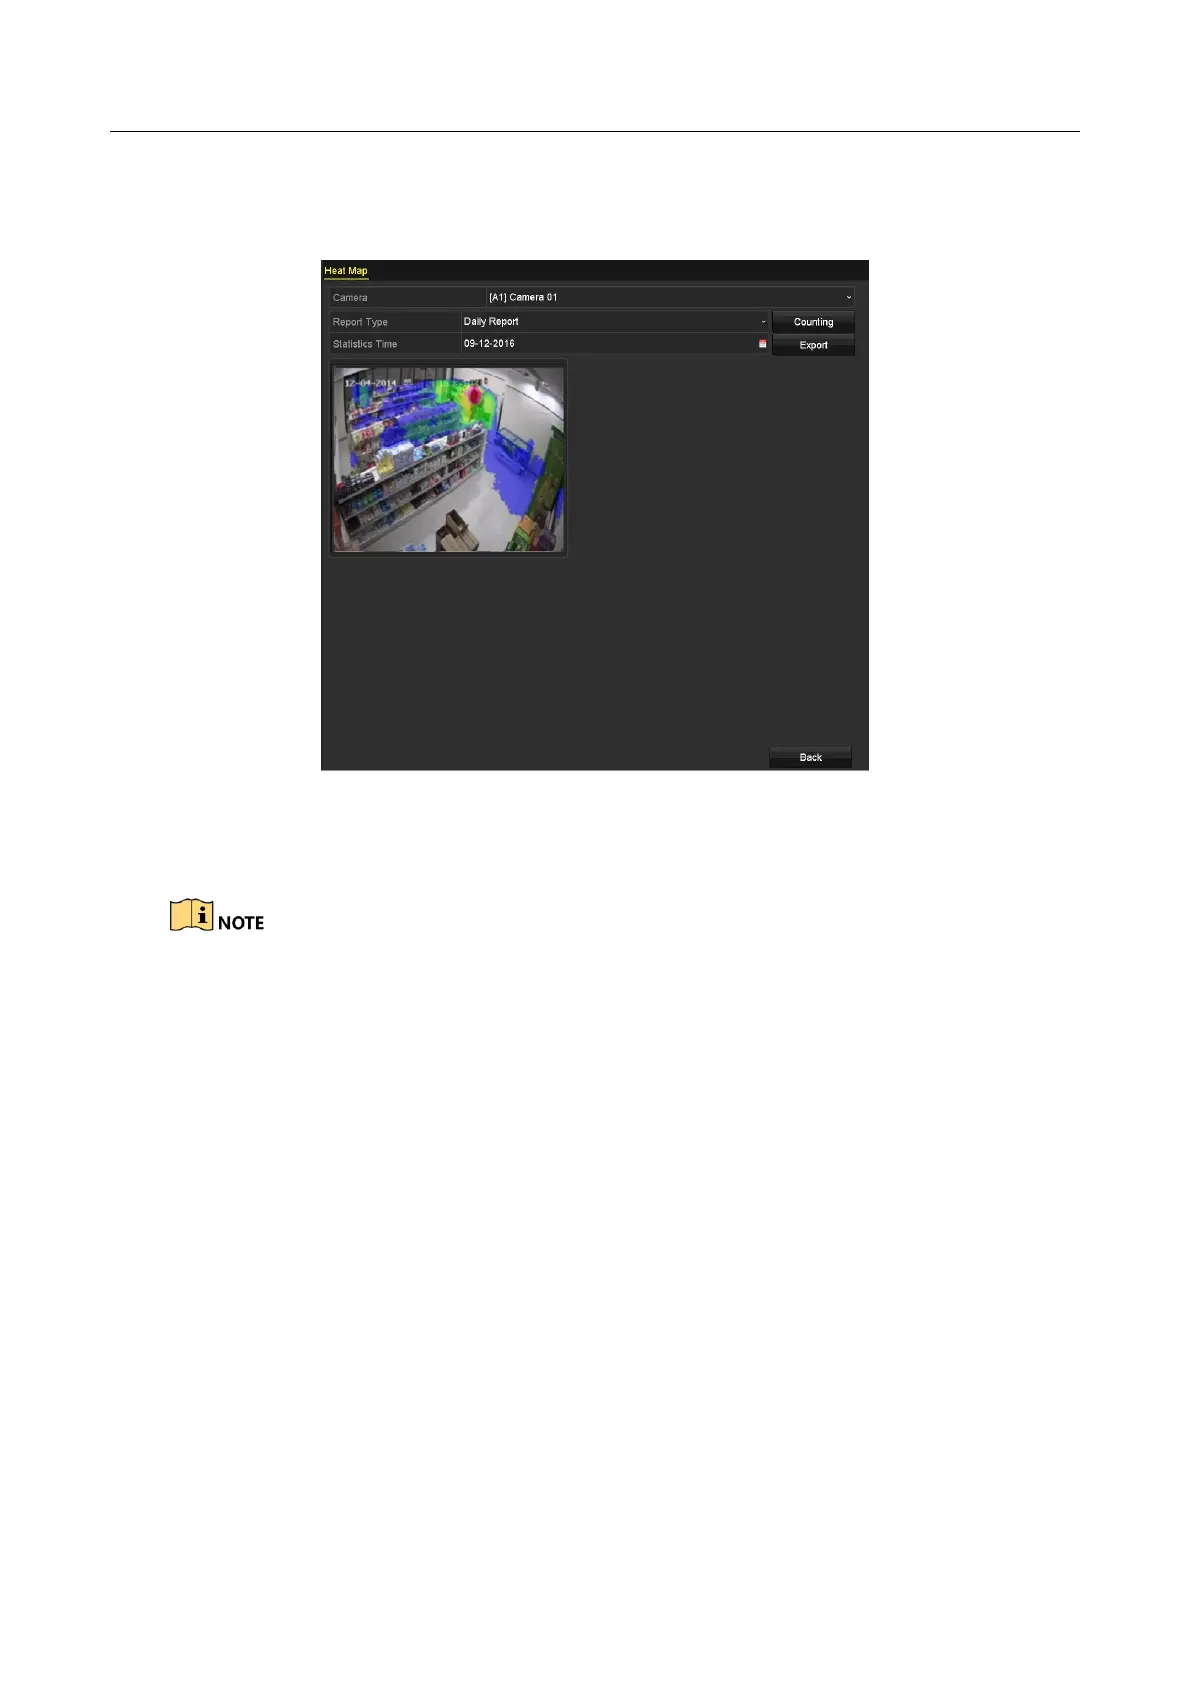
Step 3 Select the report type to Daily Report, Weekly Report, Monthly Report or Annual Report.
Step 4 Set the statistics time.
Figure 11-8 Heat Map Interface
Step 5 Click the Counting button to export the report data and start heat map statistics, and the
results are displayed in graphics marked in different colors.
As shown in Figure 10-8, red color block (255, 0, 0) indicates the most welcome area, and blue
color block (0, 0, 255) indicates the less-popular area.
Step 6 You can click the Export button to export the statistics report in excel format.
 Loading...