Network Video Recorder User Manual
152
10.5 Heat Map
Purpose:
Heat map is a graphical representation of data represented by colors. The heat map function is usually used to
analyze the visit times and dwell time of customers in a configured area.
The heat map function must be supported by the connected IP camera and the corresponding configuration must be
set.
Steps:
1. Enter the Heat Map interface.
Menu>VCA Search> Heat Map
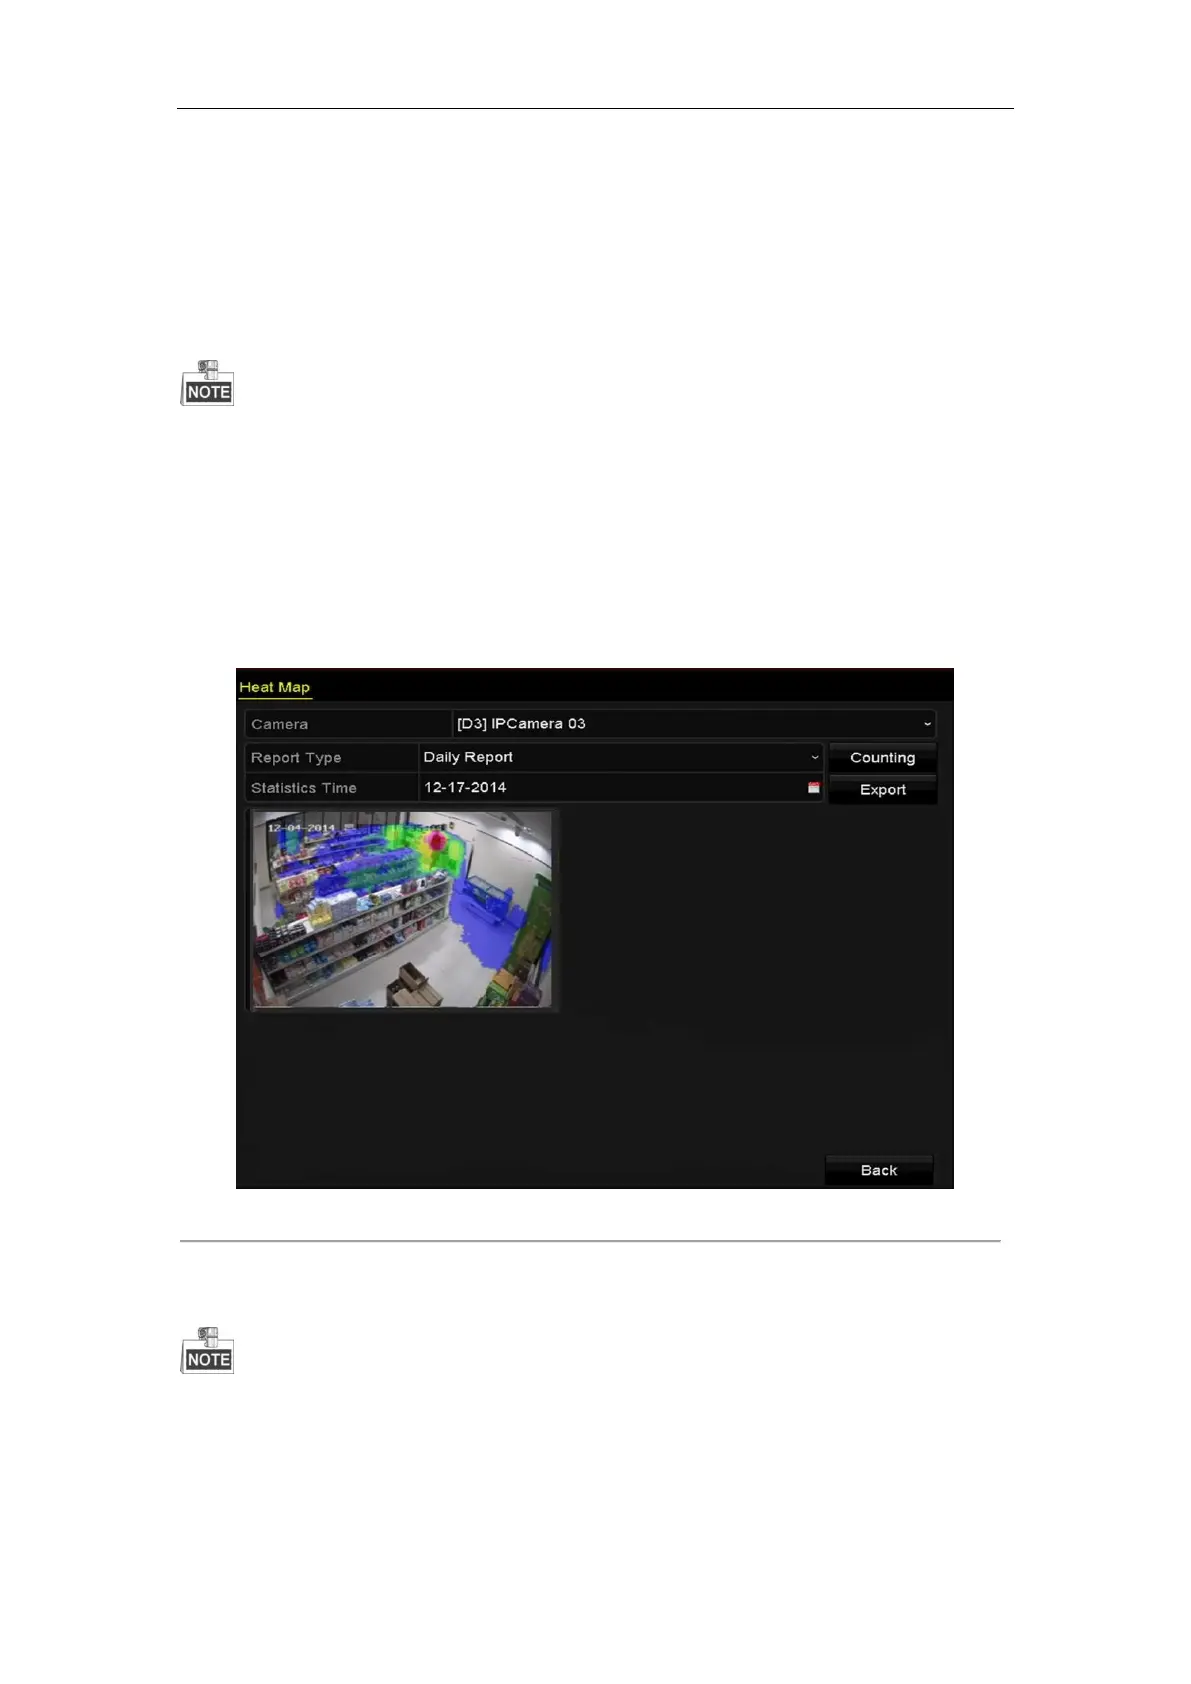
2. Select the camera for the heat map processing.
3. Select the report type to Daily Report, Weekly Report, Monthly Report or Annual Report.
4. Set the statistics time.
Figure 10. 8 Heat Map Interface
5. Click the Counting button to export the report data and start heat map statistics, and the results are displayed
in graphics marked in different colors.
As shown in the figure above, red color block (255, 0, 0) indicates the most welcome area, and blue color
block (0, 0, 255) indicates the less-popular area.
6. You can click the Export button to export the statistics report in excel format.
 Loading...