OtoRead Screener Operating Instructions Page 22
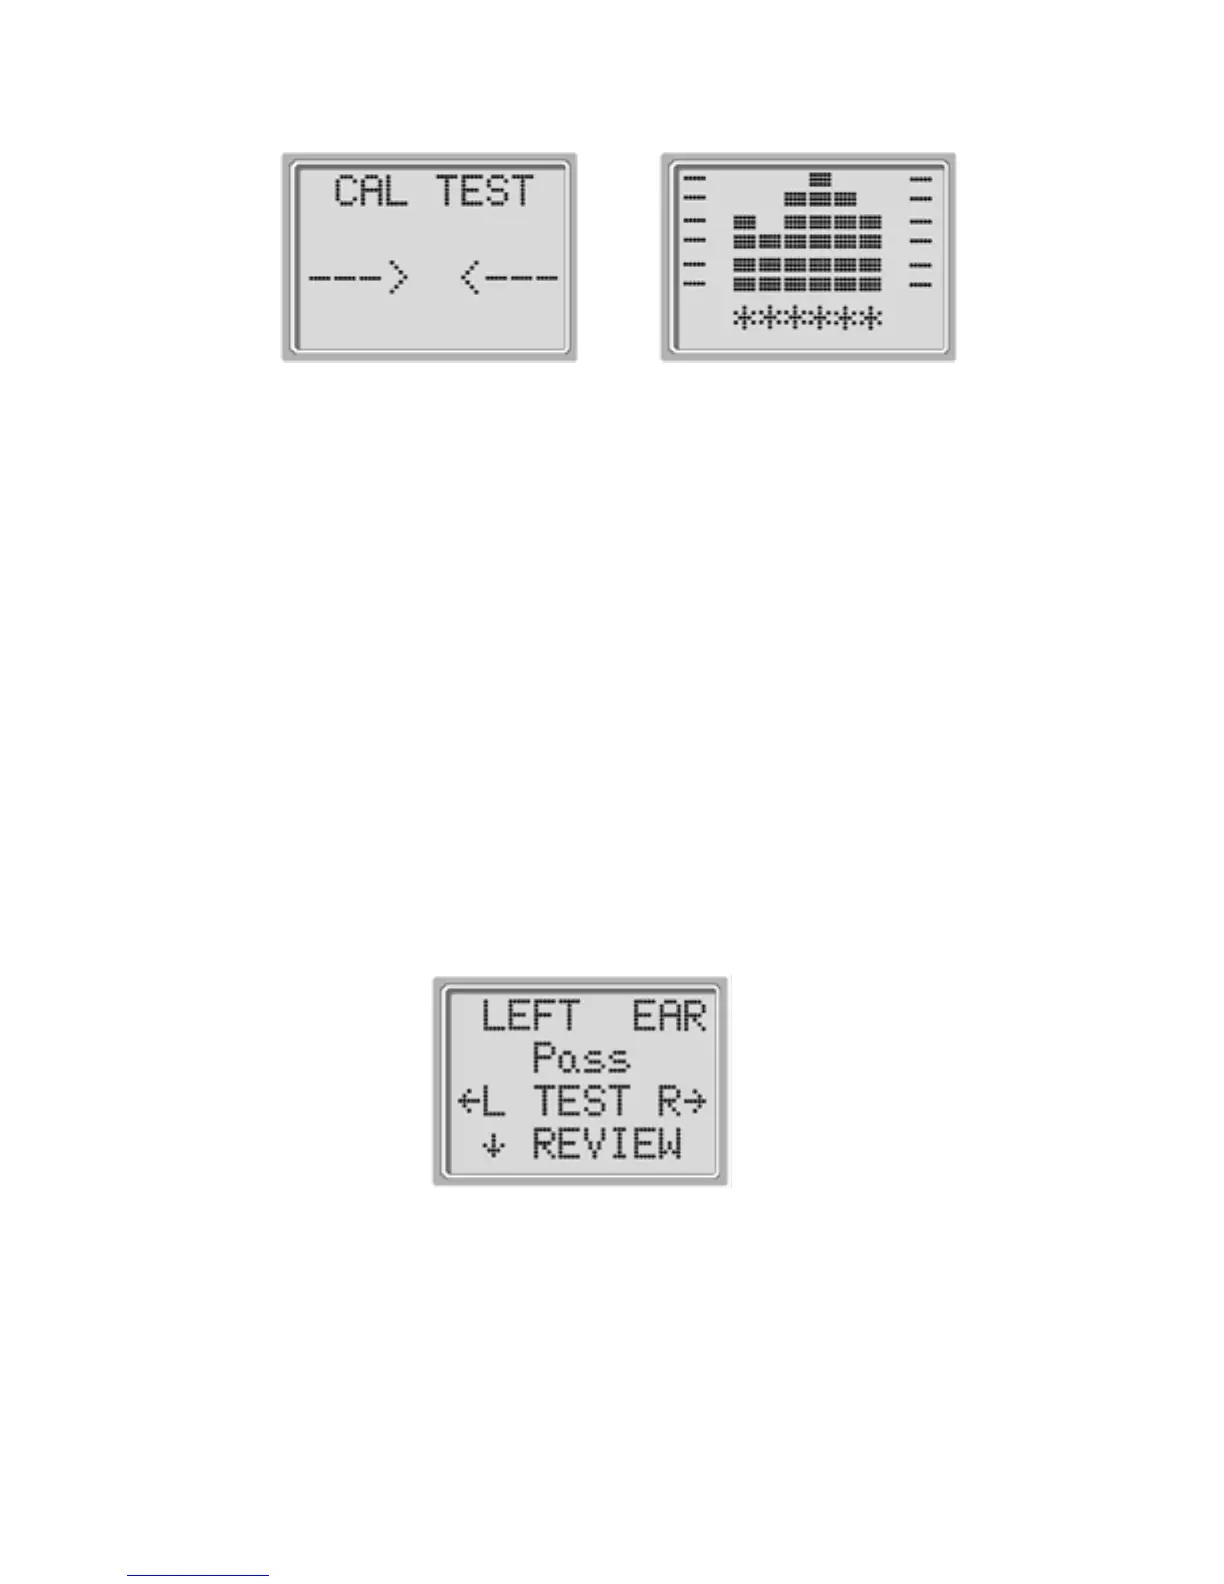
Display # 6
Display # 7
Following the automatic calibration of the test tones, a set of
bars should appear on the display (Display # 7). These are the
test results which are displayed as the emissions are
measured. One column is used to represent the signal-to-
noise ratio measured at each of the test frequencies
(DPOAEs) or in each of the frequency bands (TEOAEs).
Testing is complete when the green “READY” light is
illuminated. Both the tester and patient should remain as still
and quiet as possible until the green light turns on. The
graphic display is explained in the Interpreting Test Results
section on page 34.
Review Results
When testing is complete, a display similar to Display # 8 will
appear.
Display # 8
The results of the test are automatically saved in memory as
soon as the test is complete.