Using the Countess
™
Automated Cell
Counter,
Continued
Cell Counting
Procedure,
continued
10. The instrument takes approximately 30 seconds to count each
sample, and the cell count for live, dead, and total cells, and
percentage viability is displayed on the screen. Record the cell
count, or insert a USB drive and press Save (see page 16).
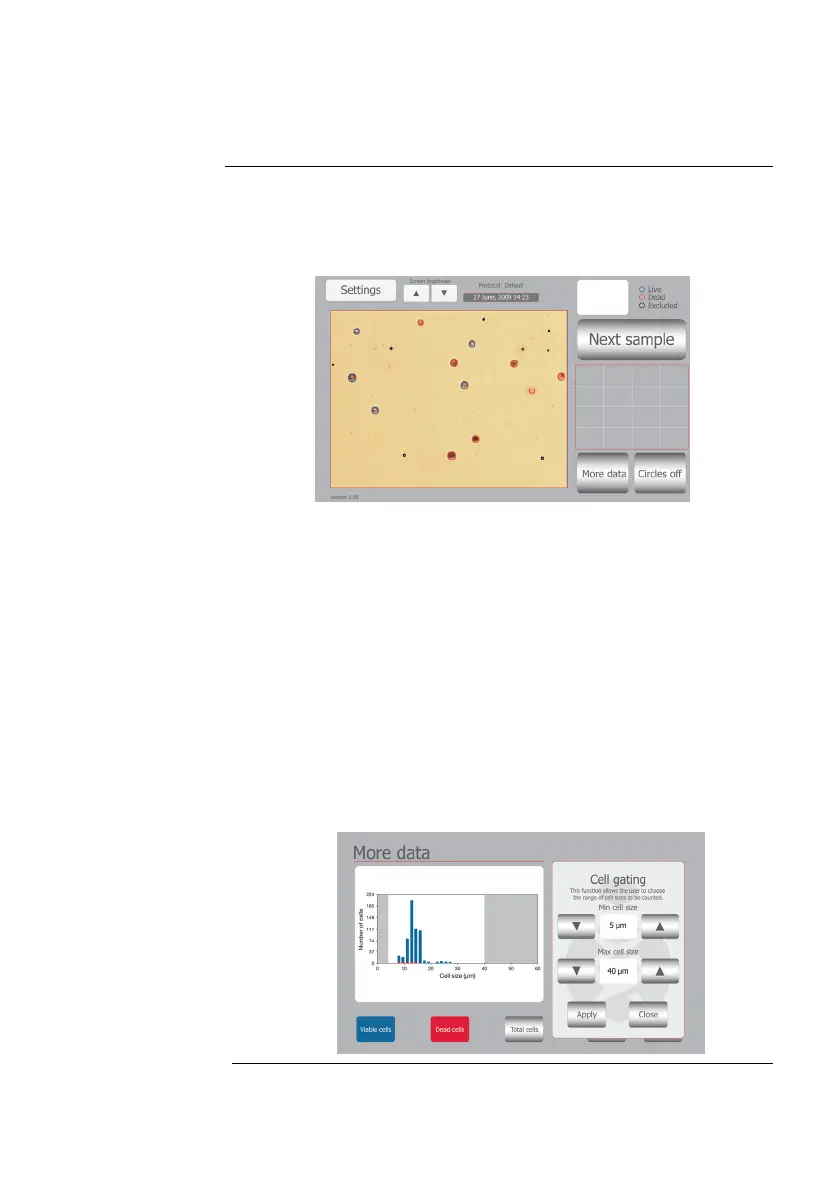
11. After a cell count is performed, use the Details button to see
how each cell was counted. Objects are circled in blue, red, or
black. Blue indicates cells that are counted as live, red indicates
cells that are counted as dead, and black indicates objects that
are excluded from the count.
12. To see more details on the data as well as graphical
representation of the data, press the More Data button.
Note: The data window in More Data allows you to further analyze
acquired data by viewing a specific data set. The data window is set
using particle size that you specify. Once the window is set, the
concentrations and particles counted are recalculated to reflect the data
window you set. Use the arrows to view only the window of processed
data you wish to view. Once you have set the window, press Apply to
view
the information box with the recalculated data set specifically for
the data window.
Continued on next page
14