iMars grid-tied solar inverters Display panel
45
6.4.2 History
Press “ ” and “ ” in the main interface to select “History”, and then press “ENT” to view the
parameters which is shown in figure 6.5.
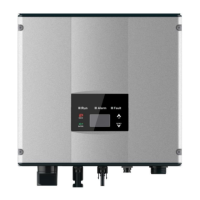
Hi s t o ry 0
201 2 / 0 1/05 1 1 :32: 1 6
A00 5 : G rid u n d er f r e q
Figure 6.5 History parameters
There are 32 history records in total. Press “ ” and “ ” to review the history record and press
“ESC” to exit. The numbers on the top right is the serial No. of the record and the numbers in the
second line display date when faults occur and settled. If the color of the third line illuminates, the
fault occurs, if not, the fault is solved.
6.4.3 Statistics
Press “ ” and “ ” in the main interface to select “Statistics”, and then press “ENT” to view the
parameters which is shown in figure 6.6.
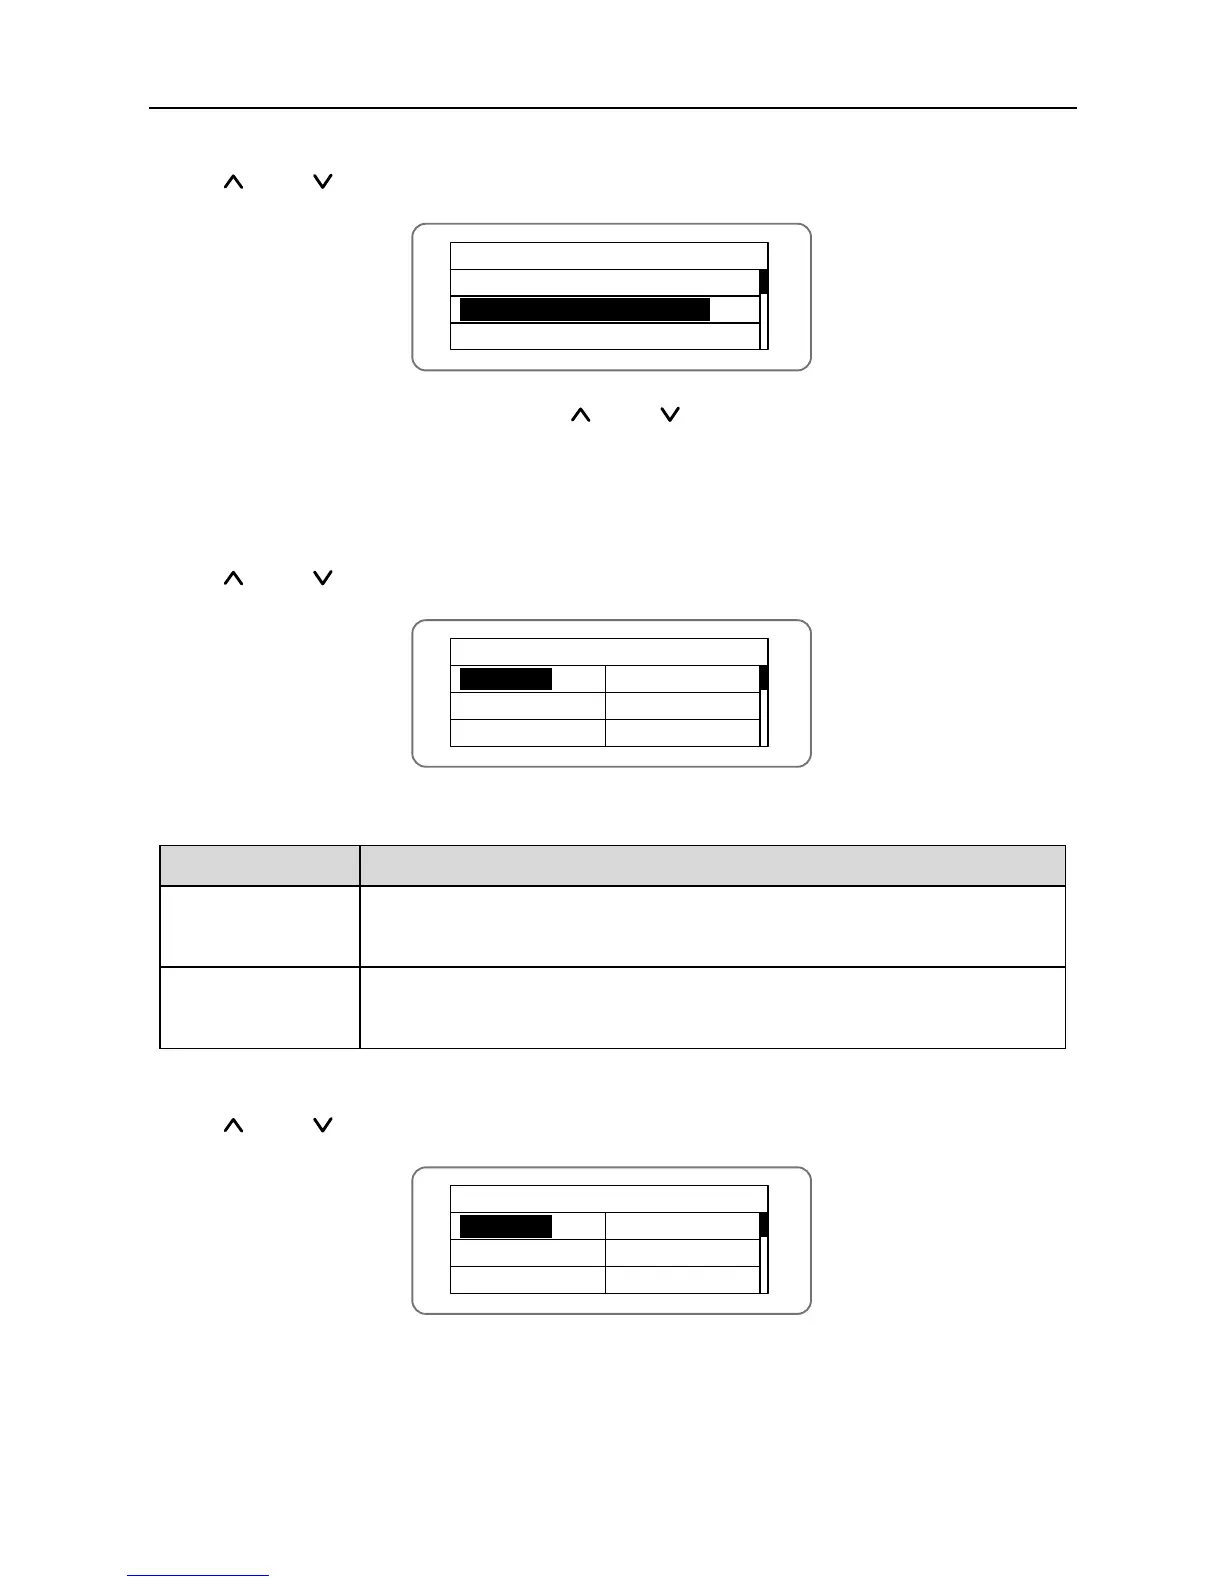
Sta t i s t ical M e n u
Lif e t i m e
Tod a y
Figure 6.6 Statistic information
The information in table 6-3 can be viewed in the statistical menu.
Table 6-3 Statistic information
Total operation time, total power produced, total power saved, total CO
2
reduction in lifetime
Total power produced, total power saved, peak power and total CO
2
reduction in current day
6.4.4 Parameter settings
Press “ ” and “ ” in the main interface to select “Setup Menu”, and then press “ENT” to view
the parameters which is shown in figure 6.7.
Set u p M enu
Add r e s s
Keypad PWD
Cas h / p r ice
Dat e / T i me
Lan g u a g e
Set M o d el
Figure 6.7 Setting information
Parameters can be set in this interface.