240 Keysight N9927-90001 User’s Guide
RTSA (Real-Time Spectrum Analyzer) Mode—Option 350 (CPU2 Only)
RTSA Mode Settings
Trace Display States
In RTSA Mode you can display up to four of the following types of trace states.
All RTSA settings are applied to all displayed traces. These traces represent the
Real-Time Spectrum in each of the three measurement modes.
A color-coded legend for displayed traces is visible in the left pane of the RTSA
mode screen:
W = Clear/Write; M = MaxHold; m = MinHold; A = Average; V = View
How to display the Trace States
—Press Trace 6.
—Then Trace 1,2,3,4
repeatedly to select a trace number to display or change
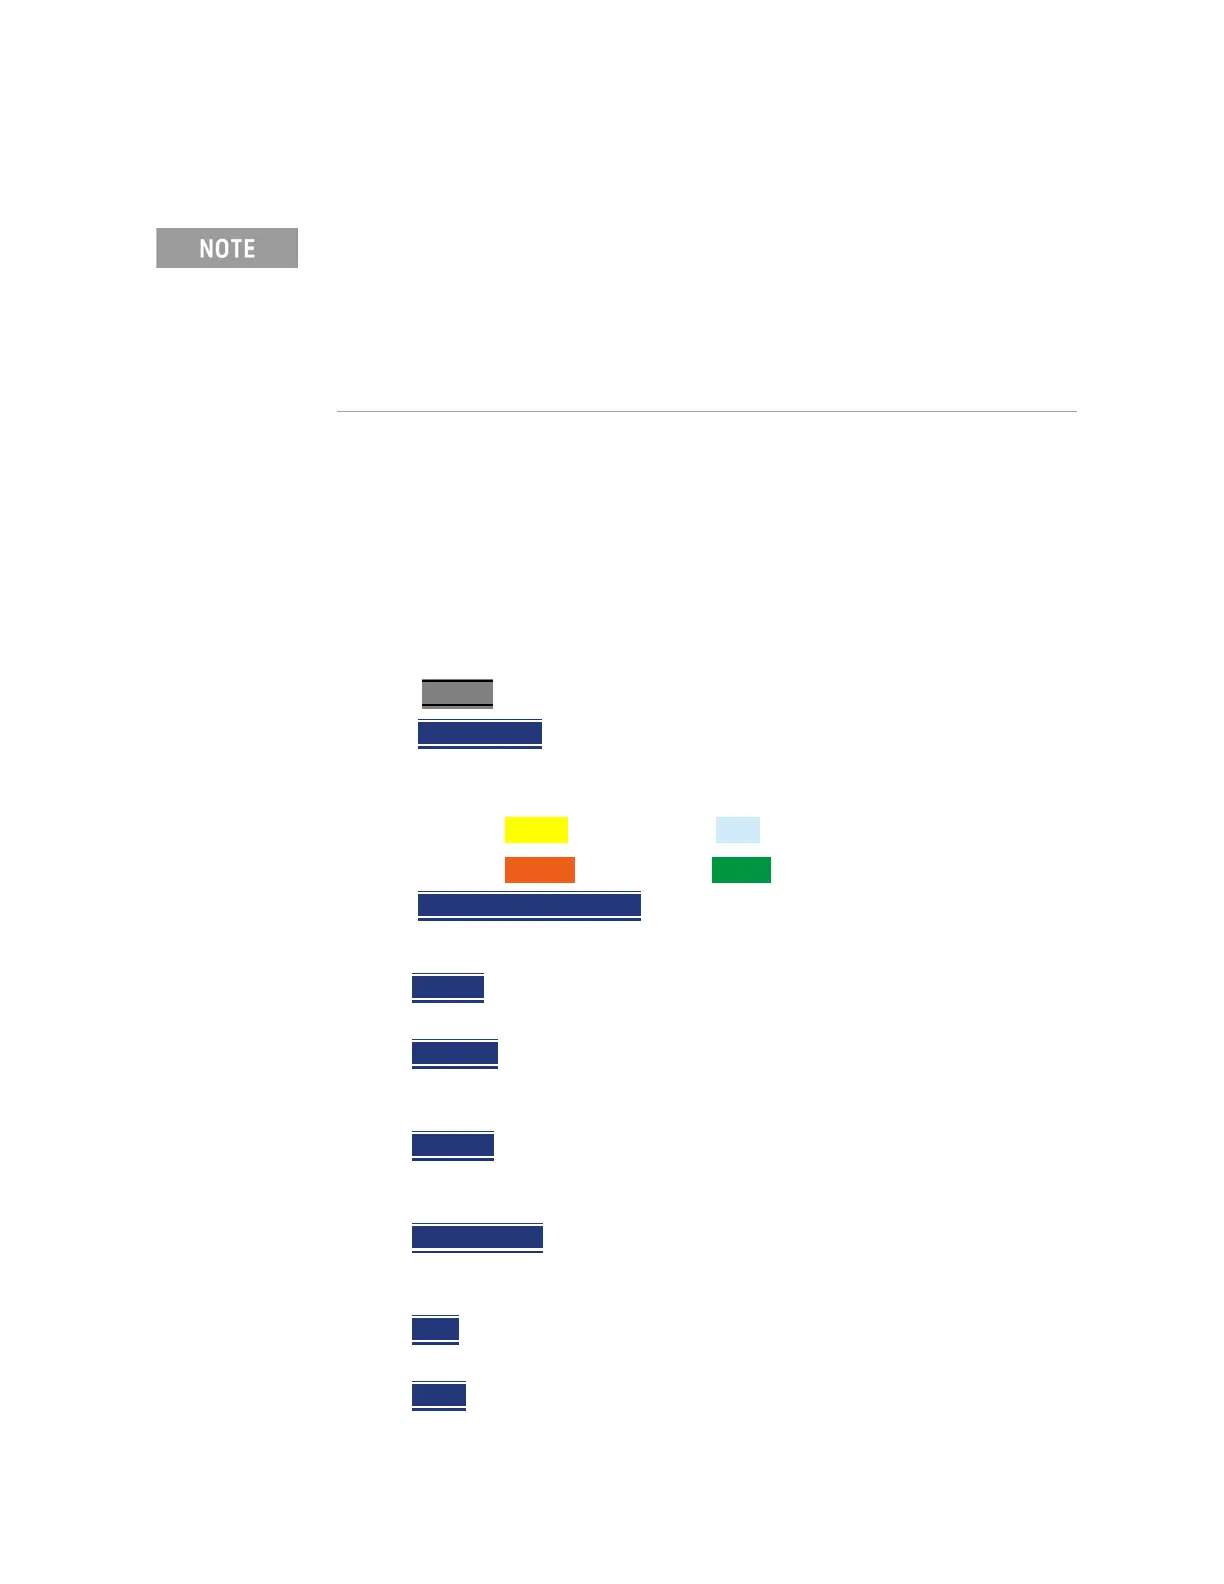
its state. Traces are displayed in the following default colors (i.e., the colors
are user settable):
—Trace 1 – Yellow Trace 2 – Blue
—Trace 3 – Orange Trace 4 – Green
—Then State [current setting]
— Then choose from the following Trace States:
—Clr /Wr
[W] (Clear/Write) Displays the actual measured data for each
sweep.
—MaxHold
[M] Displays the maximum response of the input signal at
each data point over multiple sweeps. See also Average Count in
“Average Count” on page 243.
—MinHold
[m] Displays the minimum response of the input signal at
each data point over multiple sweeps. See also Average Count in
“Average Count” on page 243.
—RMS Average
[A] Each data point is averaged over multiple sweeps as
set by the Average Count setting. Learn more in “Average Count” on
page 243.
—View
[V] Displays and then holds the last complete measurement trace
on the screen. This is similar to storing a trace in memory.
—Blank
Displays no trace.
You can use the FieldFox’s Remote Server mode (89600 VSA software
connectivity) to parse playback files and captured data as MATLAB files
(*.mat). Learn more about FieldFox and 89600 VSA software, refer to
Chapter 16, “Remote Server Mode (Requires CPU2 and SA Hardware/SA
Option 233)” and to
http://rfmw.em.keysight.com/wireless/helpfiles/89600B/WebHelp/89600
.htm.
 Loading...