64 Keysight CX3300 User’s Guide, Edition 4
Using the CX3300
Making a Measurement and Using Useful Tools
Using Math Functions and Filters
Math function can be activated from the Function tool palette. To use a math
function, drag and drop a function icon on a waveform. The calculation result is
displayed on the Main Waveform. Double-clicking the icon can substitute for this
drag and drop operation.
The Function tool palette provides the foll
owing icons used for calculating and
filtering a waveform data.
• Math Add, Subtract, Multiply, Divide, Absolute, Average, Invert, Magnify,
Max, Min, Differentiate, Integrate, Square, and Square Root
• Filter High Pass filter, Low Pass filter, and Smoothing
NOTE
You can also use the Analysis dialog box (Analysis > Functions) to use the math
functions. The dialog box is opened by clicking the Analysis icon on the sidebar.
For example, drag and drop the 1 MHz Low Pass filter icon on the Channel 1
waveform when no Function is used. The Channel 1 waveform is filtered by the 1
MHz low pass filter and the Function 1 waveform is plotted on the same graph.
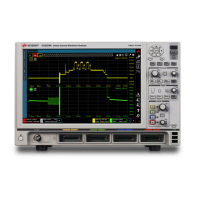
The following image shows an example of the CX3300 screen. The Main
Waveform displays two graphs. The top one shows the Channel 1 waveform and
the bottom shows the Function 1 waveform. The Measurement data view shows
the Frequency measurement result of the Function 1 waveform and the
Spectrum graph view shows the spectrum plot of the Function 1 waveform.
Channel 1 waveform
Function 1 waveform
Measurement data view
Spectrum graph view