Keysight CX3300 User’s Guide, Edition 4 69
Using the CX3300
Using Data Logger Mode
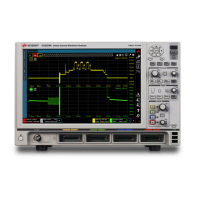
Waveform Playback
You can replay and analyze the waveform database by using the tools shown
below and the tools in the tool palette.
• Waveform database indicator:
Shows the waveform database information.
• Playback time range selector:
Shows the playback time range of the waveform database and allows you to
set the time range by dragging each side of the selector bar.
• Playback run control (a, b, c, and d shown in the above image):
a. Starts or stops the playback.
b. Enables or disables the repeat playback.
c. Displays the waveform data at the beginning or end of the playback time
range.
d. Displays the waveform data at the previous or next time interval. If the
Waveform Analytics is performed and some of clusters are selected, the
waveform data of the selected clusters are displayed on the graph.
• Selected cluster indicator:
Shows ID of the clusters selected in the Waveform Analytics tool palette. The
above image shows that the clusters L1-1, L1-2, and L1-3 have been
selected. If no cluster is selected, this indicator shows nothing.
Waveform database indicator
Playback time range selector
Playback run control
Selected cluster indicator
a
b
c
c
dd