3 Spectrum Analyzer Mode
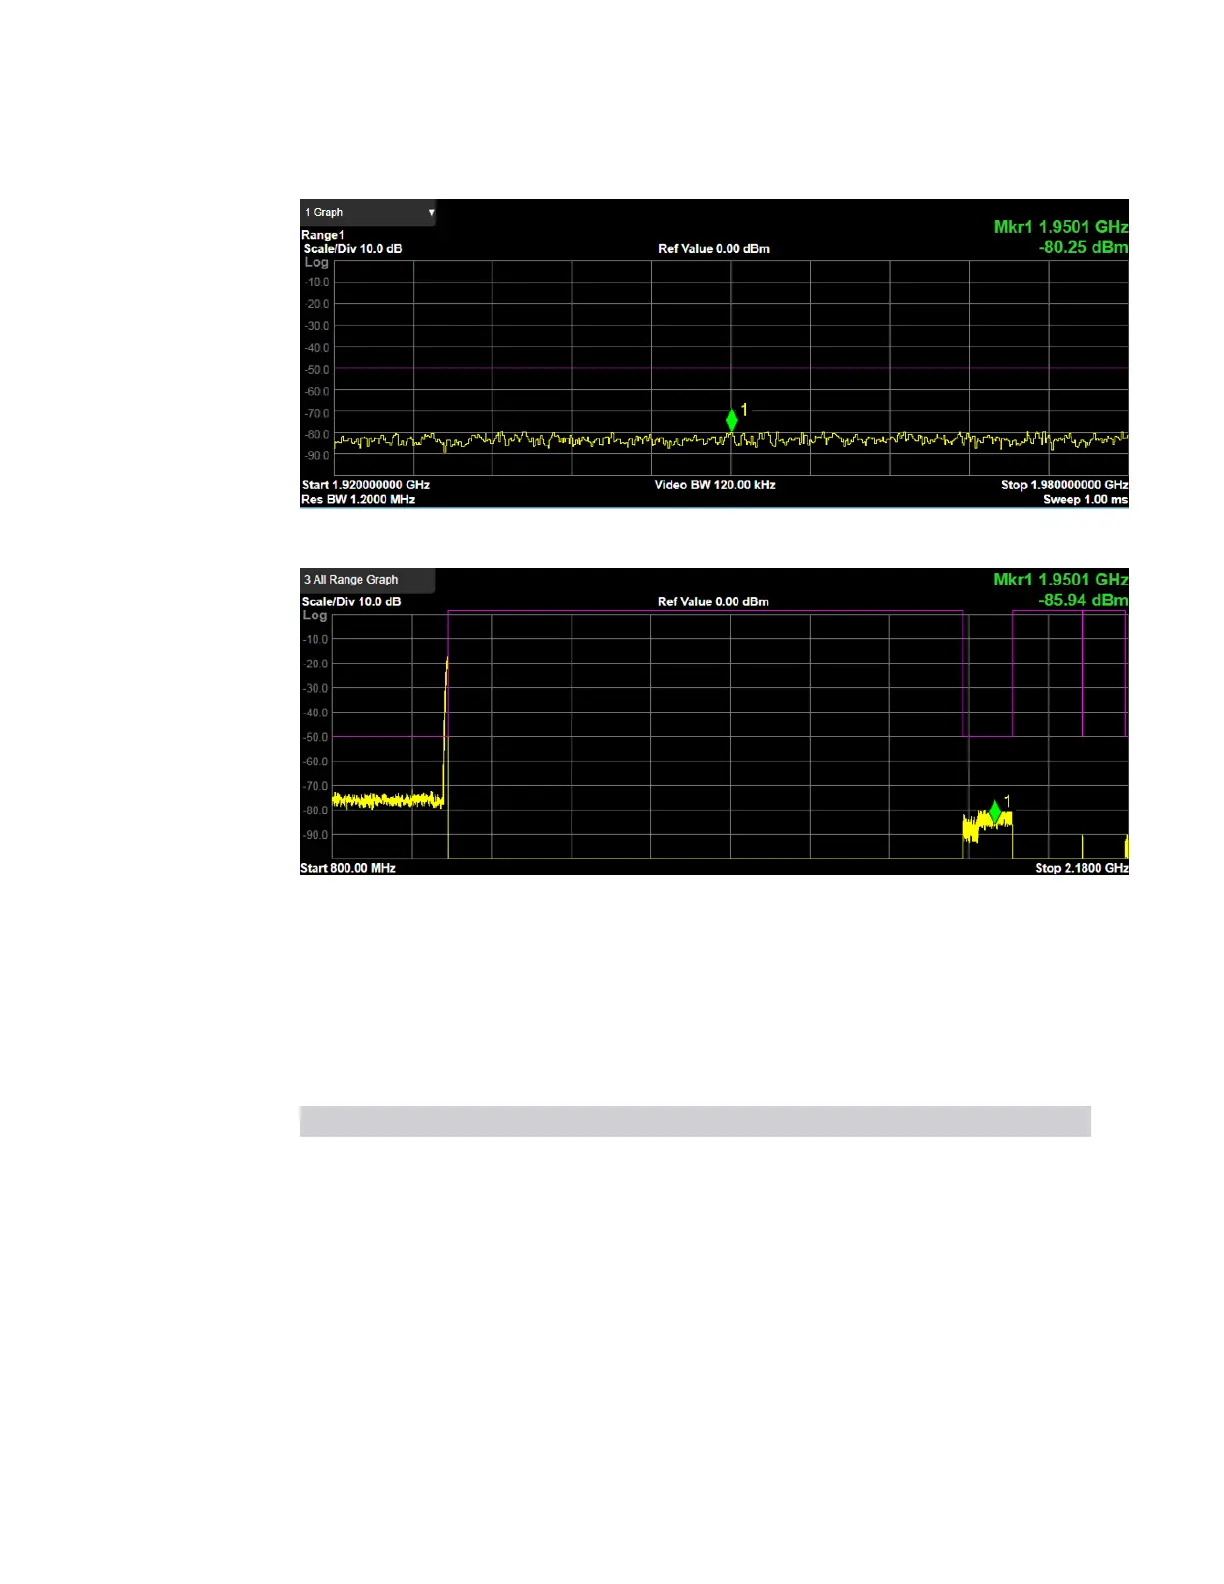
3.8 Spurious Emissions Measurement
When All Ranges is selected
3.8.2.2 Table
Window #2
The spurs listed are within the current value of the Marker Peak Excursion setting of
the absolute limit. All the spurs listed passed. Any spur that has failed the absolute
limit has an ‘F’ beside it.
Result Units Min Max
Spur N/A 0 200
Range N/A 1 20
Frequency Hz Analyzer Min Analyzer Max
Amplitude dBm Analyzer Min Analyzer Max
Limit dBm -200 50
ΔLimit dBm (Limit - Amplitude)
Views in which the Table window appears:
1356 Spectrum Analyzer Mode User's &Programmer's Reference