16
Analyzing
S
S
M
M
A
A
R
R
T
T
E
E
R
R
G‐SENSORdata
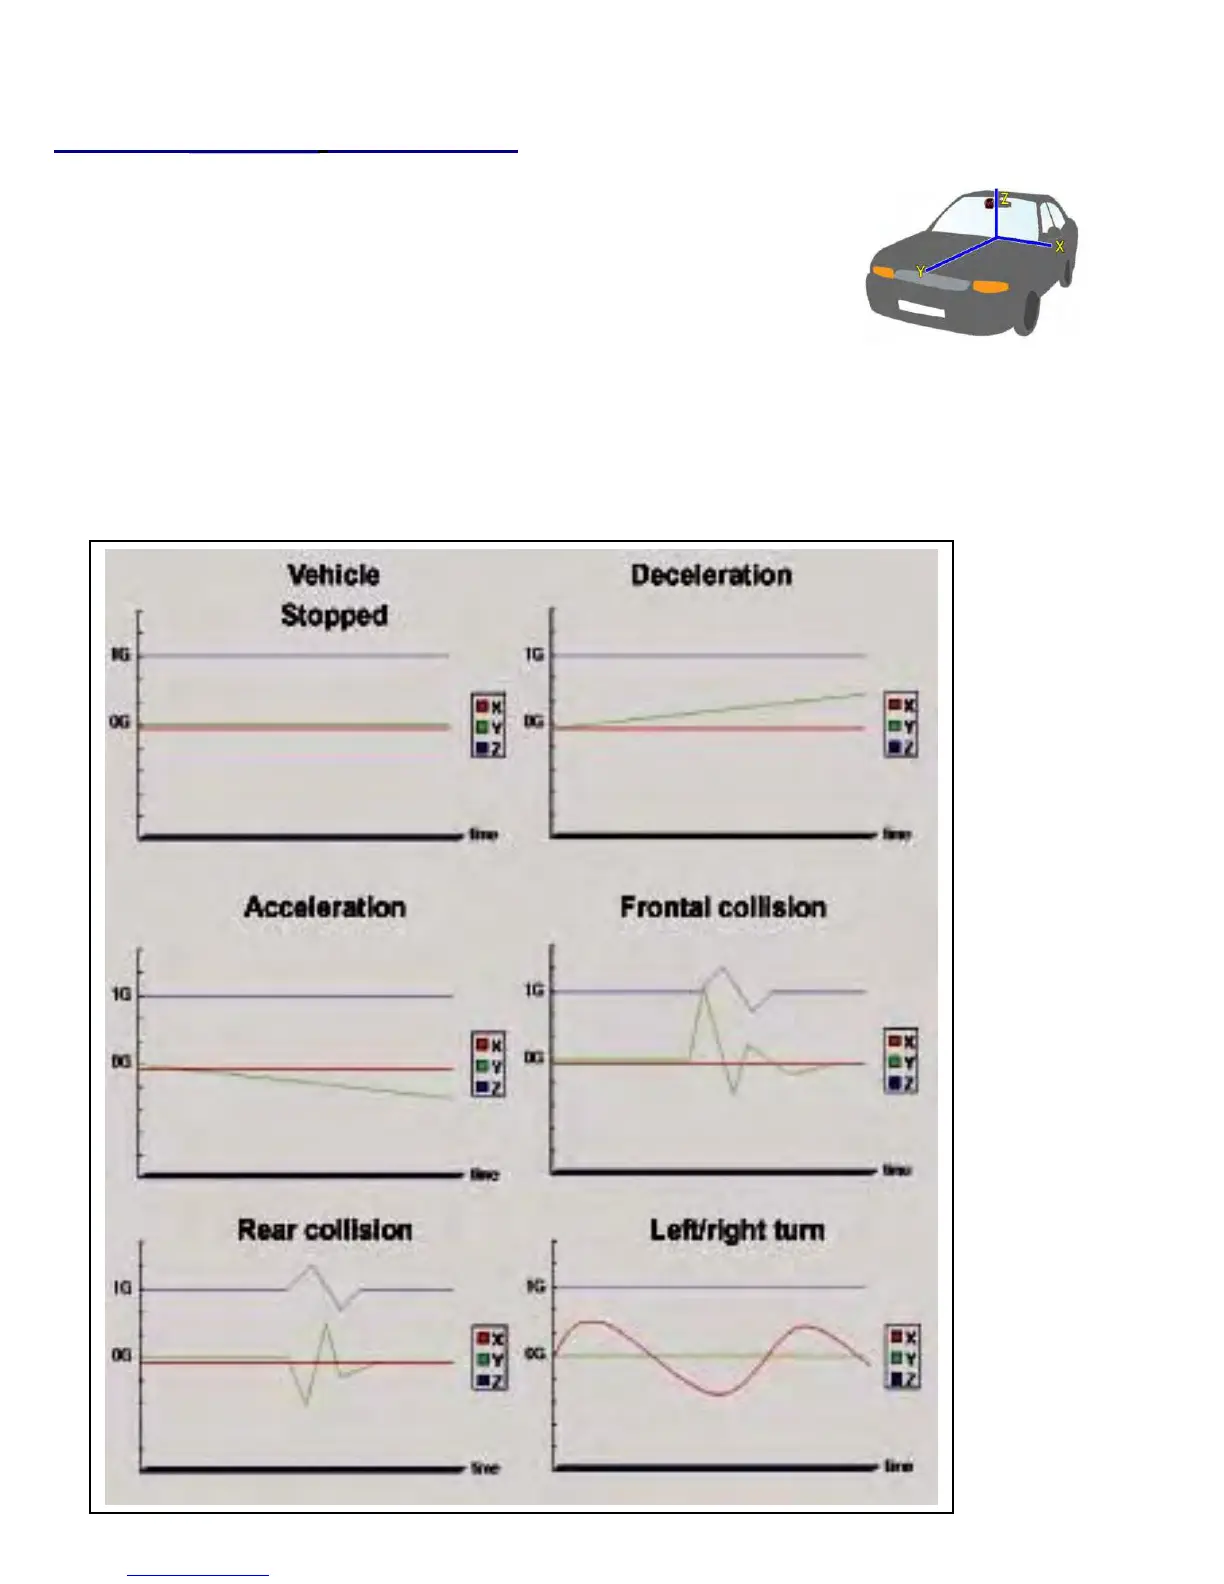
TheG‐sensor(GravitySensor)furnishesdataforX,YandZaxisandstoresitalongwith
theotherrecordeddataontheSDcard.Whenusingtheplaybacksoftware,thisinformation
isrepresentedinagraphicformat.Theresultinggraphmaybeusedtoanalysisthedriving
conditionanddriver’ssafeorabusivehabits
.Dependingonthetypeofthevehicle,the
amplitudeofthecurveofshownmayvary.
*Xaxis:left+rightofthevehicle
*Yaxis:front+rearofthevehicle
*Zaxis:top+bottomofthevehicle