LAUNCH X-431 Euro Mini User Manual
25
Graph – displays the parameters in waveform graphs.
Combine – this option is mostly used in graph merge status for data
comparison. In this case, different items are marked in different colors.
On-screen Buttons:
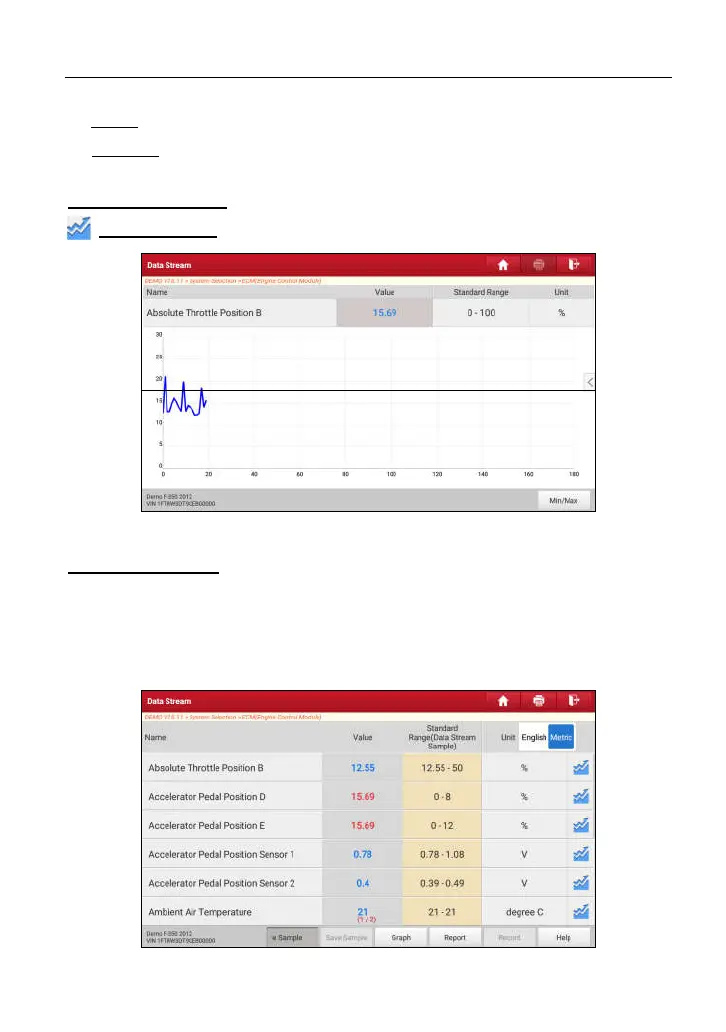
Graph(Single):
Tap it to view the waveform.
Fig. 5-12
Compare Sample:
Tap it to select the sample DS file, the values you
customized and saved in process of DS sampling will be imported into the
“Standard Range”(See below) column for your comparison.
*Note: Before executing this function, you have to sample the values of data stream
items and save it as a sample DS file.
www.diagtools.eu, Pernavas 43A, Riga, Latvia, LV-1009, +37129416069, info@diagtools.eu