LAUNCH X-431 Euro Mini User Manual
27
Tap the Min./Max. value to change it. After modifying all desired items, tap
“Save” to save it as a sample DS file. All DS files are stored under the “Data
Stream Sample” file in “User Info”.
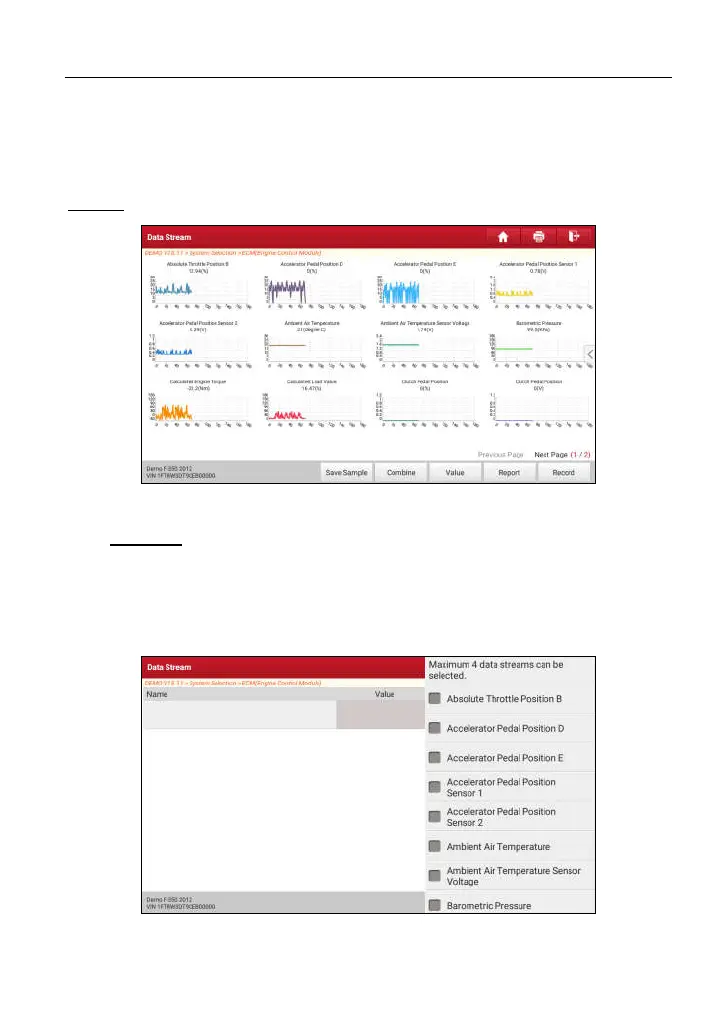
Graph:
Tap it to view the waveform.
Fig. 5-16
•
Combine
: This option is mostly used in graph merge status for data
comparison. In this case, different items are marked in different colors
(maximum 4 items can be displayed on the same screen simultaneously).
If the graph is more than one page, swipe the screen from the left to jump
to the next page.
Fig. 5-17
www.diagtools.eu, Pernavas 43A, Riga, Latvia, LV-1009, +37129416069, info@diagtools.eu