Check the Exposure (cont’d) 29
Check the Exposure (cont’d)
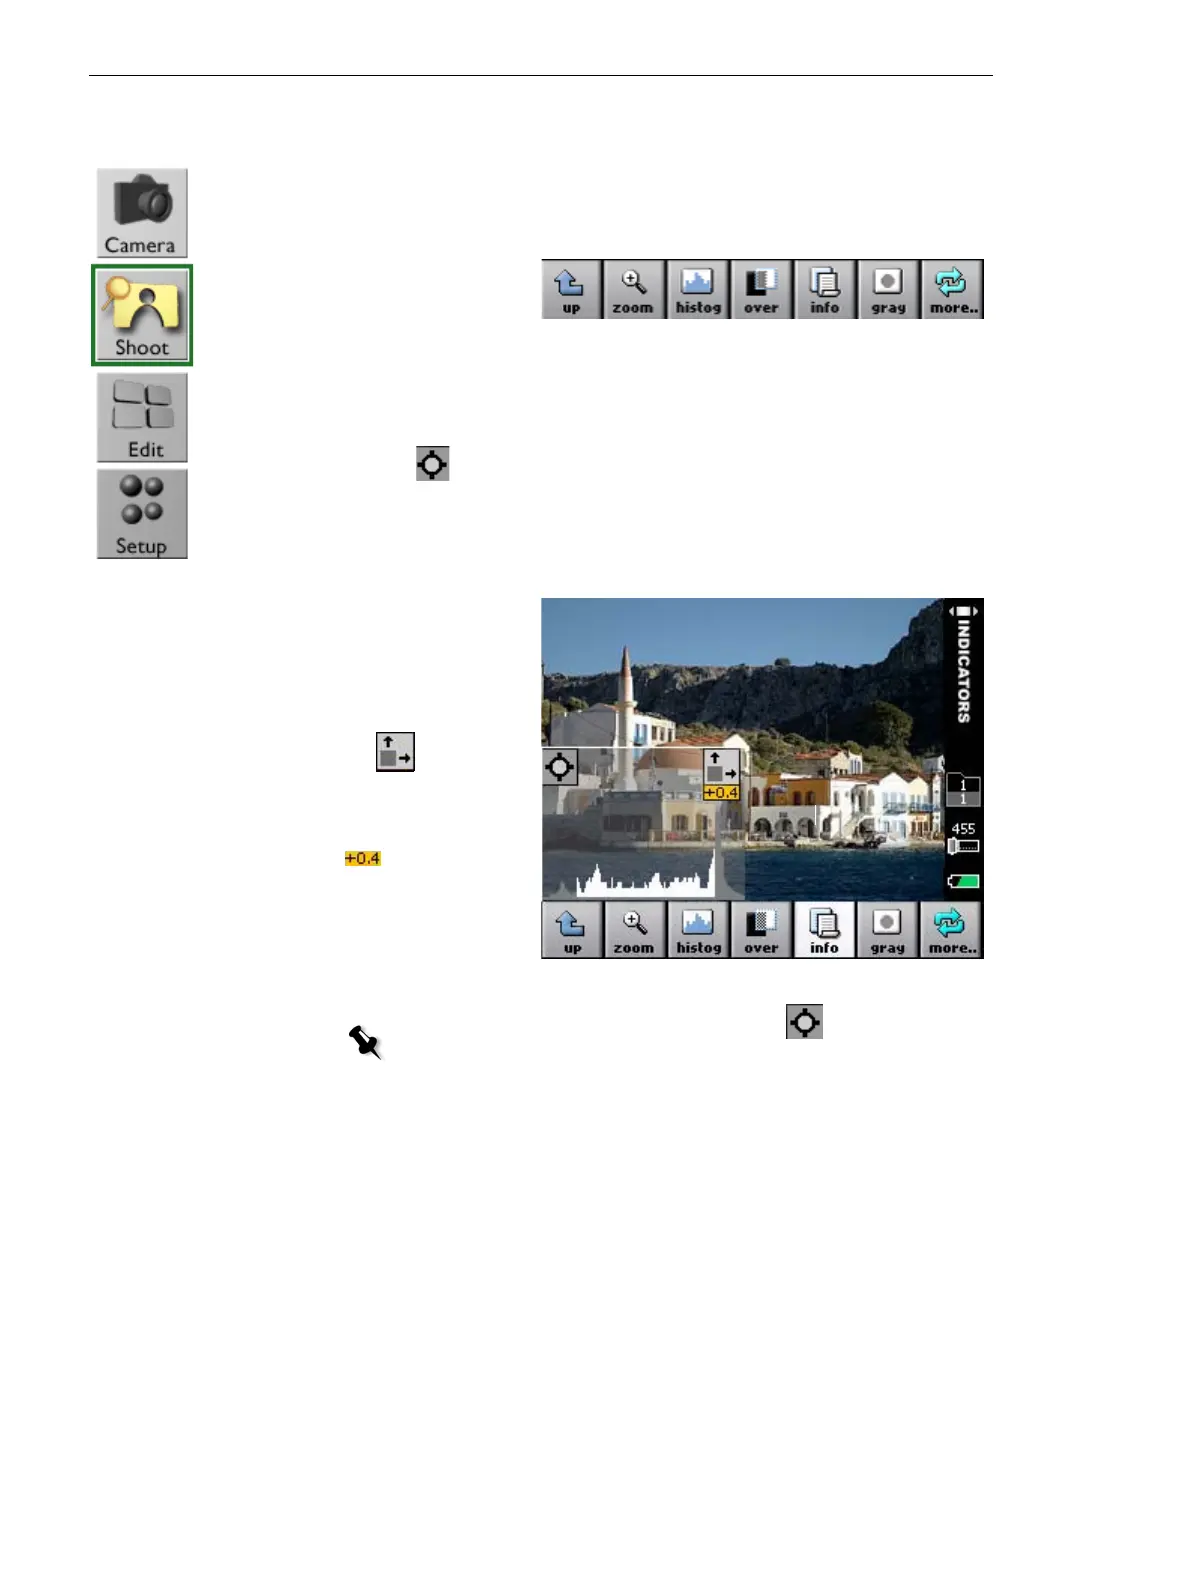
Using the Histogram and Picker Tool
1. Ta p histog.
2. Examine the histogram to check that most of the
exposure data lies within the exposure limits. Exposure
data that lies within the limits is shown in white.
Overexposed and underexposed data is shown in gray.
3. Tap , and then tap a spot on the image. The spot
that you tap is marked by a magenta circle. A magenta
line on the histogram indicates the exposure data
related to the spot
.
Tap to enlarge the
histogram.
The exposure meter,
, shows
the overall
exposure in f-stops.
Note: To remove the spot from the image, tap on the histogram,
and then tap outside the image area.