Operation Manual
touchTymp MI 26
and
MI 36
Version
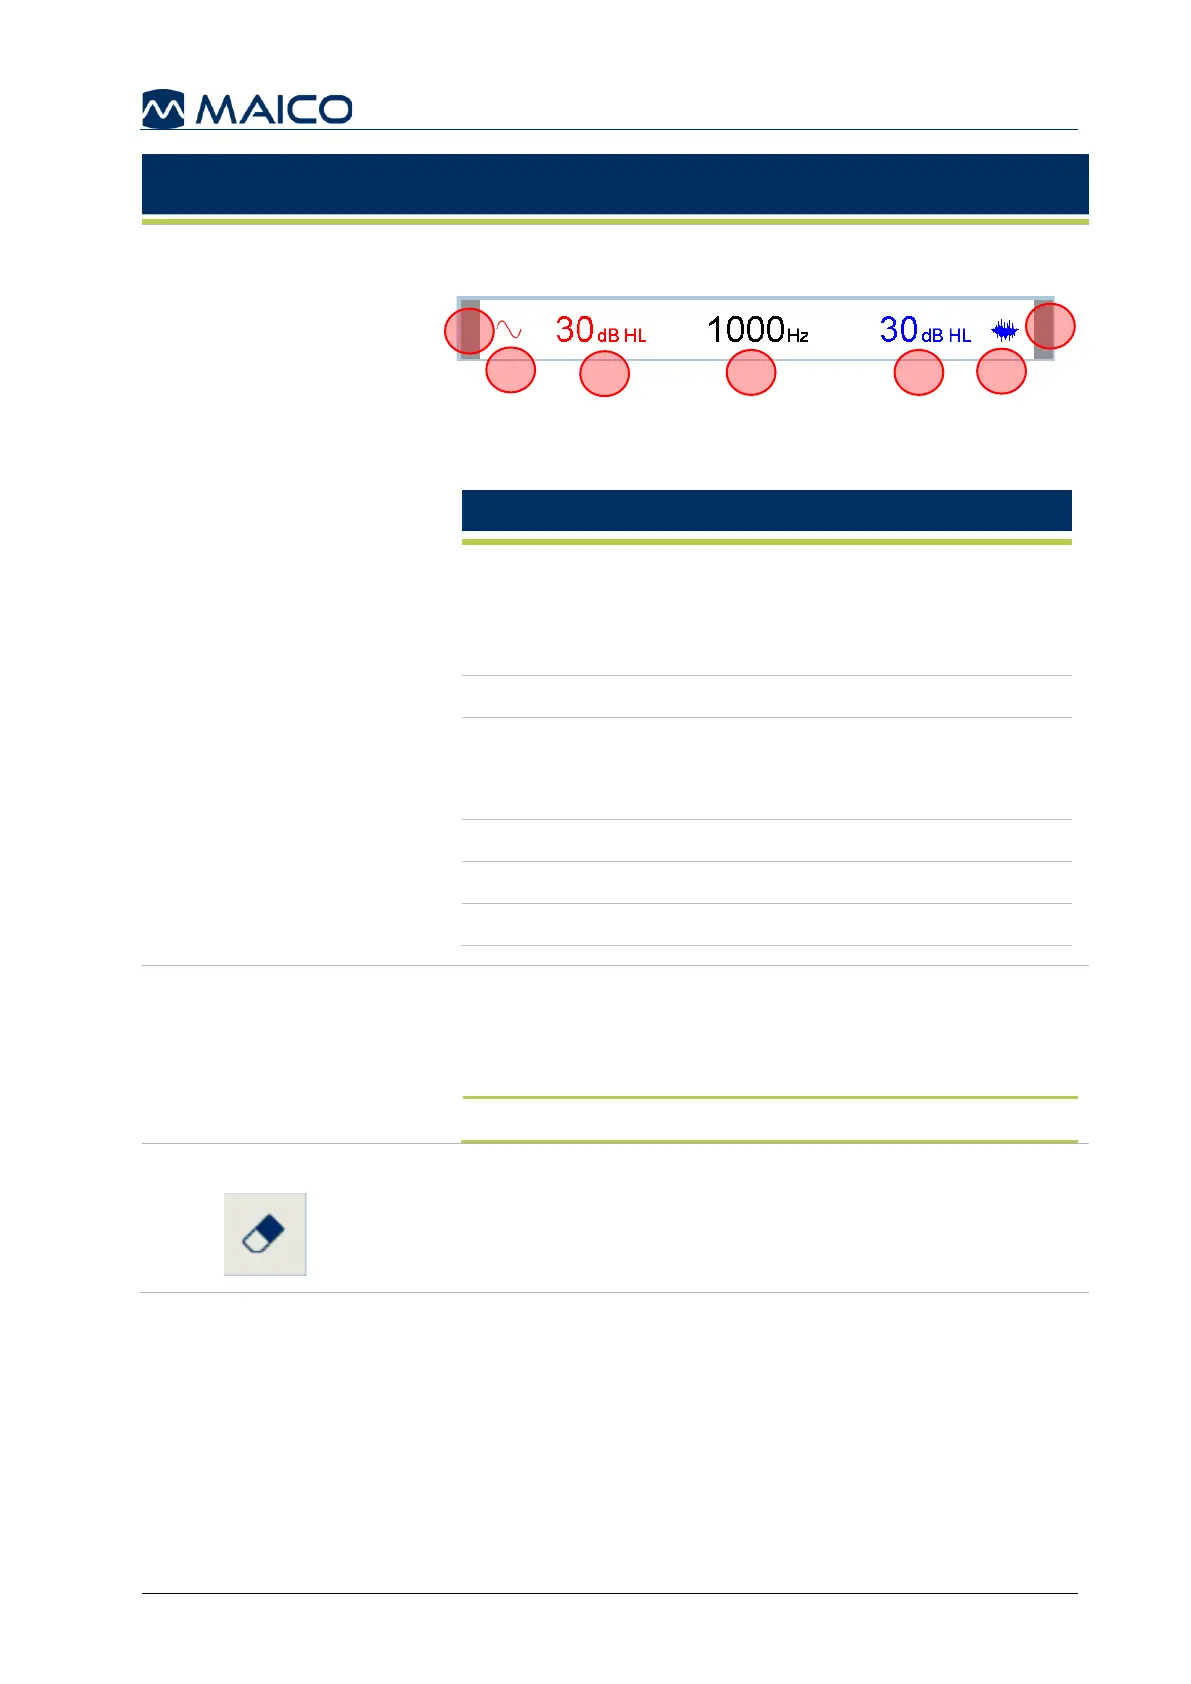
The numerical display for the testing operation of the device
(Figure 88).
Figure 88
The information includes (Table 14):
Table 14 Status Bar explanation
When a stimulus is presented to the patient the
small box on the edge of the bar turns green. The
left is for the test signal and the right box is for the
masking noise.
Stimulus symbol (i.e. pure tone, pulse, etc.) for test ear.
Hearing level of test signal, displayed in the color
of the ear being tested (Right ear/Red, Left
ear/Blue).
Frequency of test signal.
Masking level displayed in the color of the non-test ear.
Results are stored on the device for later printing or
transferring to the PC. The display can be configured to
Graph, Table or None within the settings. See section
5.6.16 for more information.
NOTE: None-setting display does not allow storing of results.
Only shown in Edit mode (see Table 12). Single
measurement results can be deleted.
 Loading...