11
Masimo
www.masimo.com
10
Masimo
www.masimo.com
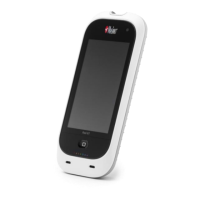
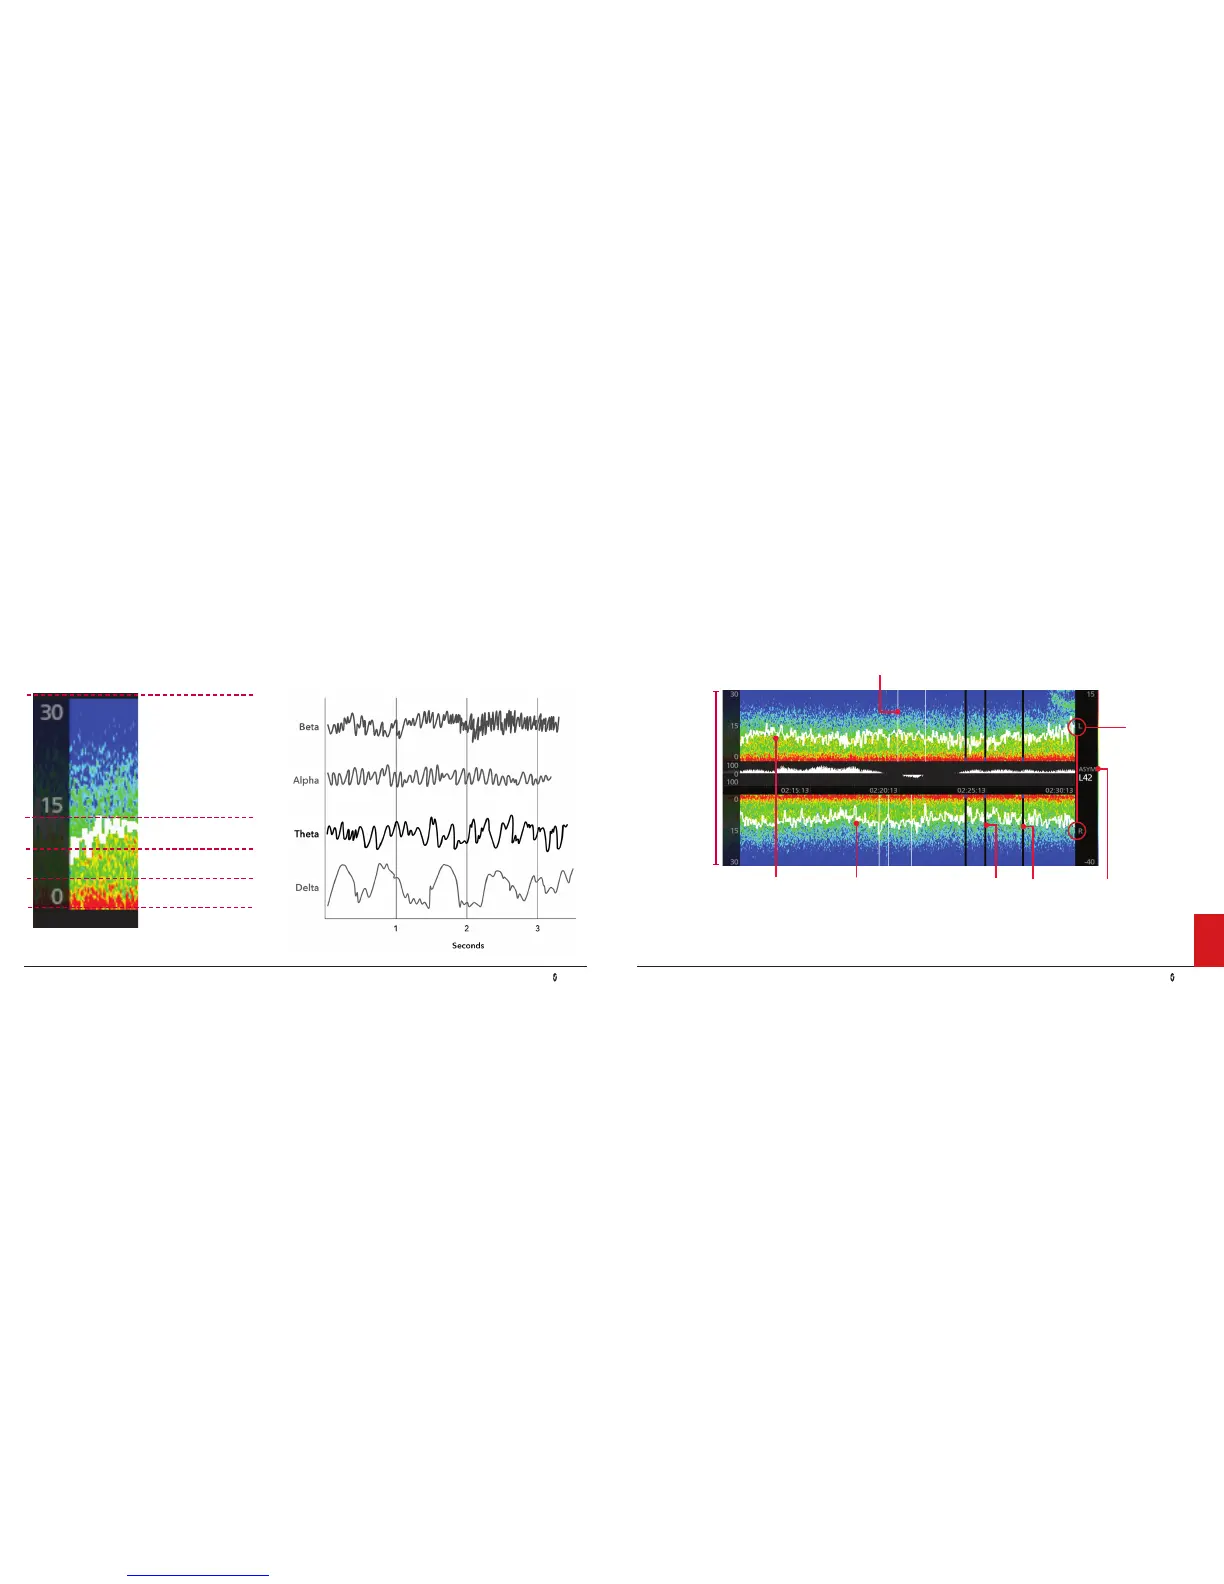
Density Spectral Array (DSA) Understanding the DSA
DSA
Frequency Bands
Beta
(13 - 30 Hz)
Alpha
(8 - 12 Hz)
Theta
(4 - 8 Hz)
Delta
(0.5 - 4 Hz)
Representative EEG Waveforms
Periods of artifact (ARTF) are conveyed by vertical white lines.
Frequency Scale
The DSA
represents power
between 0-30 Hz
or 0-40 Hz.
The “L” and
“R” horizontal
color graphs
represent the
activities of
the EEG from
the left and
right frontal
scalp regions,
respectively.
95% spectral edge frequency (SEF) is
displayed on each of the left and right
color graphs as a white trend line.
Periods of suppression are conveyed by
vertical black lines with a blue bar at the
0 Hz timeline for both the left and the right
sides. (Periods of no data are conveyed by
vertical black lines only.)
Asymmetry Graph -
Visualizes and quanties
the difference in brain
activity between the
left and the right sides
using an asymmetry
measurement.
 Loading...