9
Masimo
www.masimo.com
8
Masimo
www.masimo.com
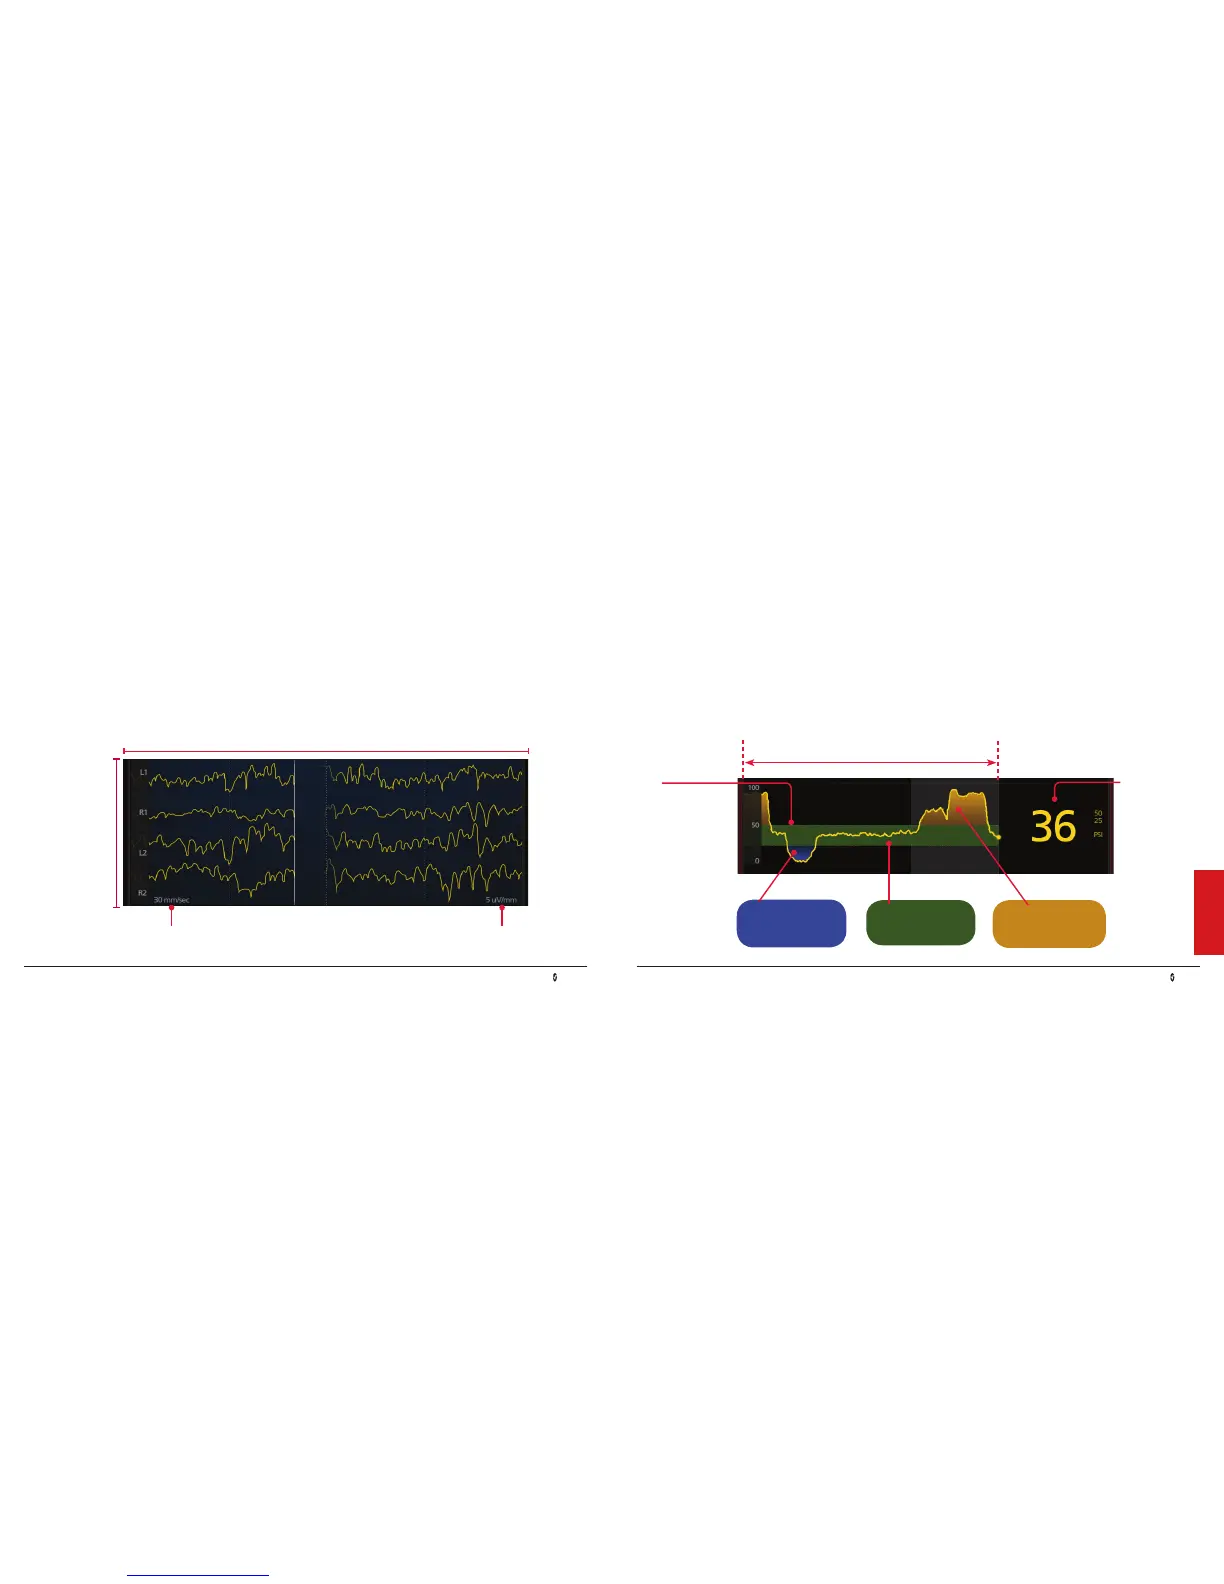
EEG Display Patient State Index (PSI)
EEG and PSI
Numeric Value
When there is
insufcient EEG
data to calculate
a PSI, the PSI
numeric value
will be replaced
by dashes (--)
Trend
PSI trend conveys PSI
numeric values over
a period of time. The
horizontal axis represents
time, and the timeframe
displayed is congurable
by the user.
Blue conveys that
the PSI reading is
below the user-
congurable lower limit.
Green conveys that
the PSI reading is
within the user-
congurable limits.
Yellow conveys that
the PSI reading is
above the user-
congurable upper limit.
Expanding and Contracting Trend
Pinch any trend display to expand or contract the
timeframe displayed for all trending parameters.
• The EEG waveforms reect electrical activity of the frontal and pre-frontal cortices of the brain.
• The display is congured to contain 4 data input sources, acquired from the 4 sensor electrodes: L1, R1, L2, and R2.
Default waveform speed is 30 mm/sec.
Touch to congure speed.
Vertical Axis
Displays the
amplitudes
for different
electrodes
The PSI is a processed EEG parameter that is related to the effect of anesthetic agents, and takes into consideration,
among other factors: (1) changes in power in various EEG frequency bands; (2) changes in symmetry and
synchronization between critical brain regions; and (3) the inhibition of regions of the frontal cortex.
Default waveform amplitude is 5 uV/mm
Touch to congure amplitude.
Horizontal axis represents time

 Loading...