Pump Performance
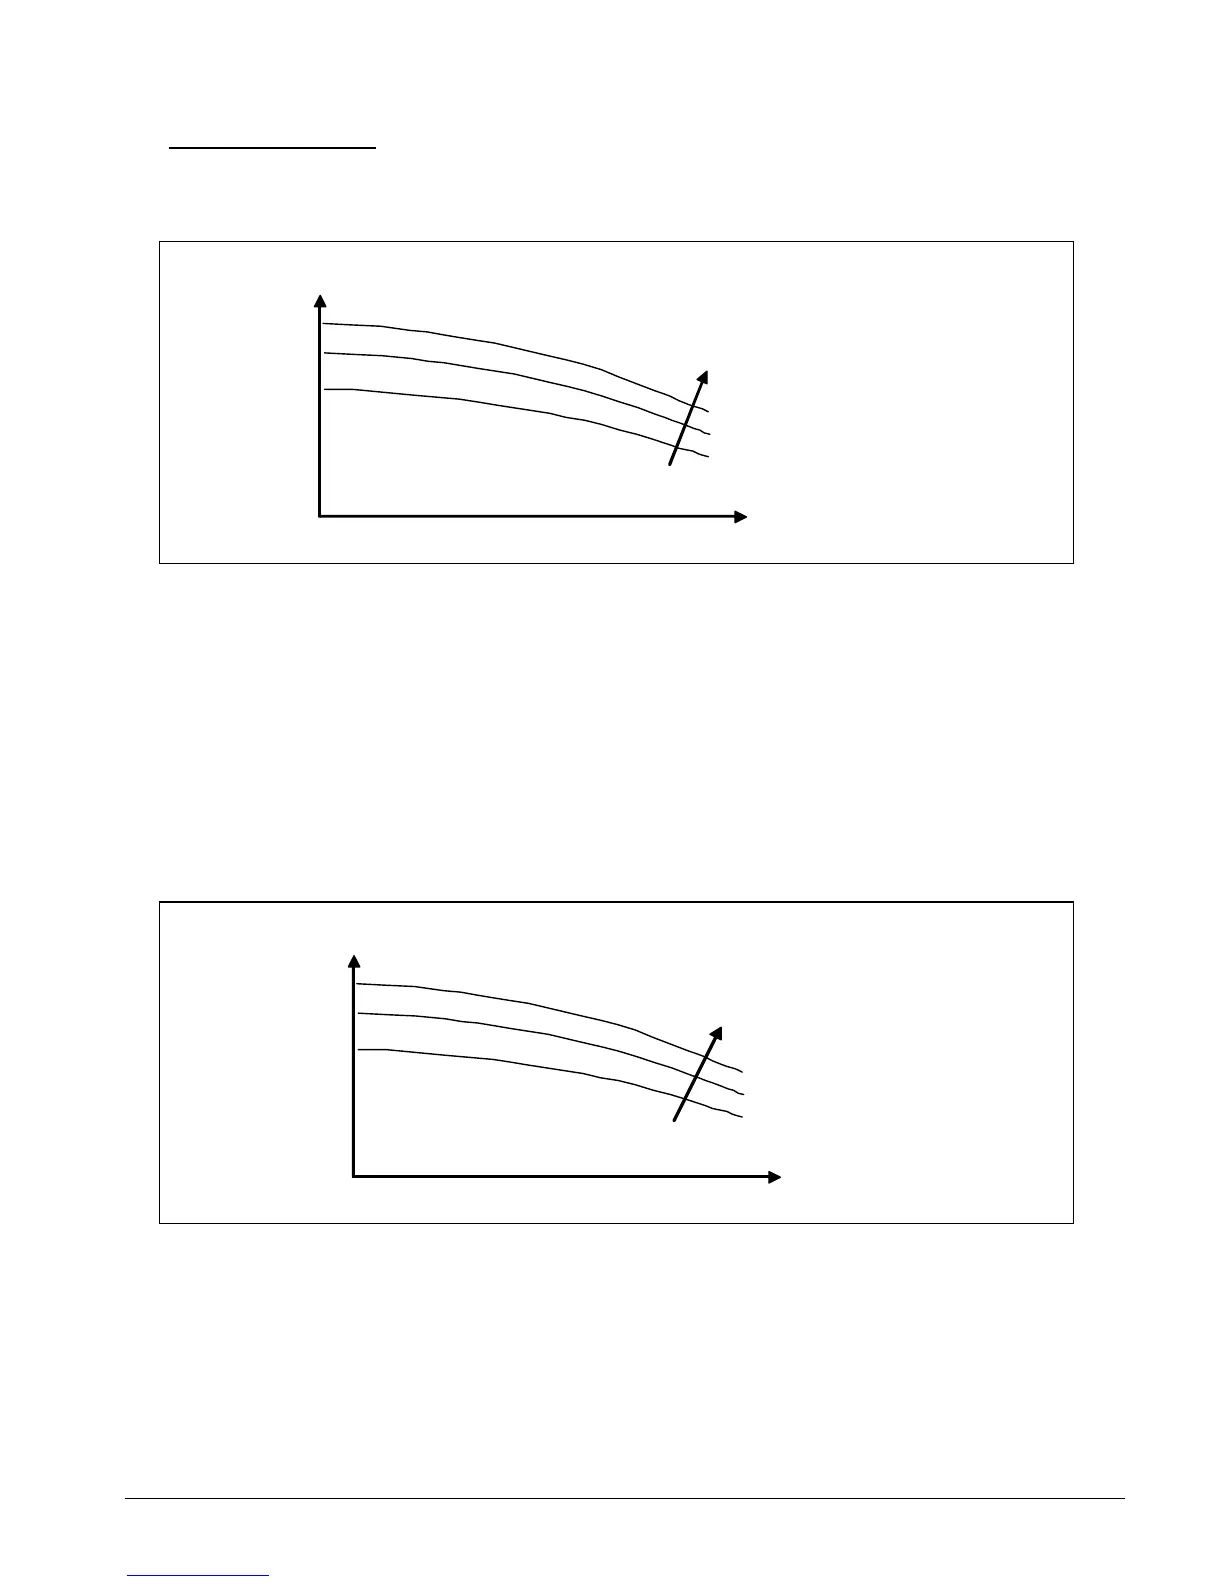
One of the most useful performance chart of a pump is the P-Q curve, which describes
the relationship between the head pressure (P) vs. the volumetric flowrate (Q). The shape
of the curve is as follows:
P
With increasing impeller
diameter
Q
This curve shows that when the head pressure increases, the flow rate reduces (and vice-
versa). By calculating the system pressure drop, we can thus determine the flow rate when
the pump is running. Hence, we can check whether the system pipe design is suitable for
a particular pump application.
This pump head pressure can also be measured at the pump discharge port by using a
pressure gauge.
The above curve is for a single fixed speed pump. If the pump were to operate under
different power supply frequencies (e.g. from 50 Hz to 60 Hz), another set of curves must
be used.
For variable speed pumps, the P-Q curves will look as follows:
P
With increasing
RPM speed of
impeller
Q
Section 5 Page 75