38 D24030 | Date 11/2018
Operation and control
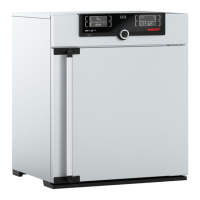
4. By turning the turn control, adjust the
desired lower alarm limit, in the example
on the right 50 % rh.
ALARM
min
50.0%rh
max
60.0%rh
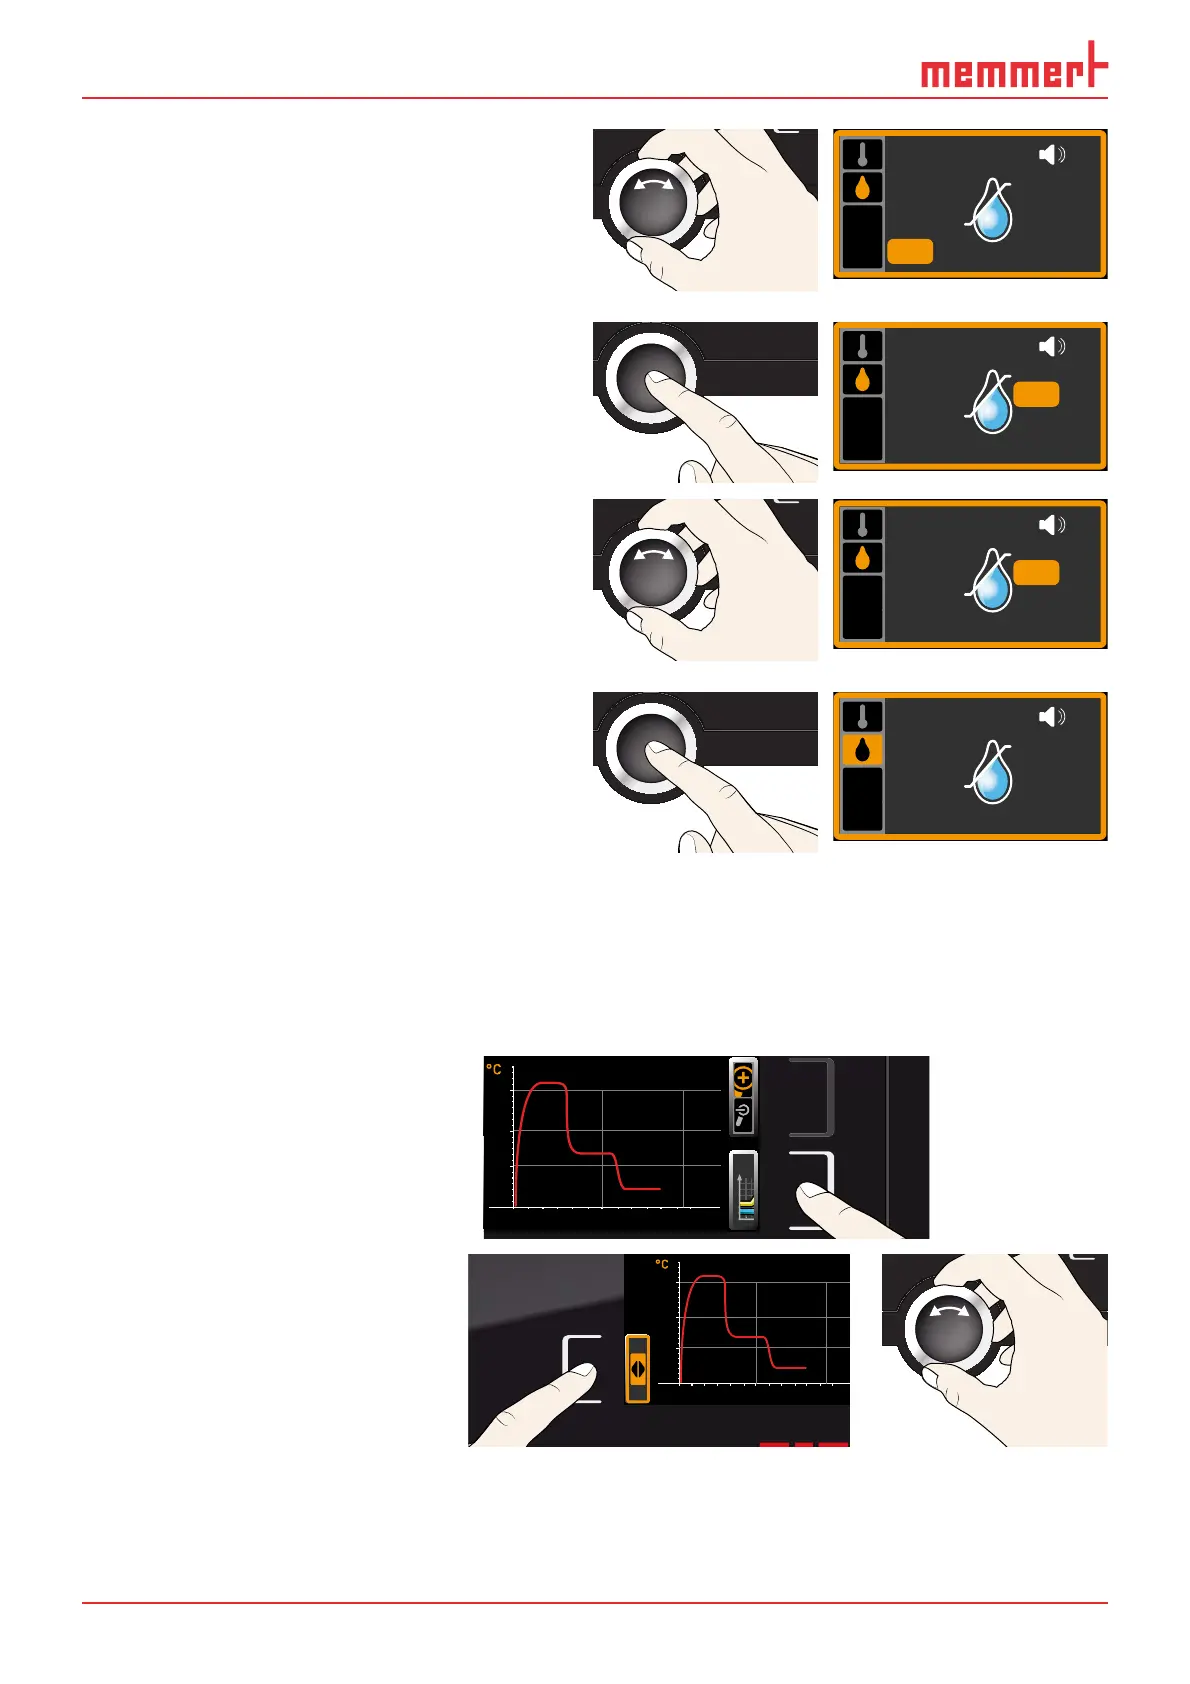
5. Accept the selection by pressing the con-
firmation key. The upper humidity alarm
limit is automatically highlighted.
ALARM
min
50.0%rh
max
60.0%rh
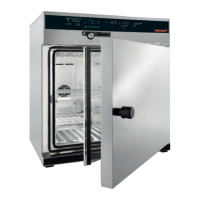
6. By turning the turn control, adjust the
desired upper alarm limit, in the example
on the right 70 % rh.
ALARM
min
50.0%rh
max
70.0%rh
7. Accept the selection by pressing the
confirmation key and leave the
Alarm
display by pressing the activation key on
the side. Humidity monitoring is now
active.
ALARM
min
50.0%rh
max
70.0%rh
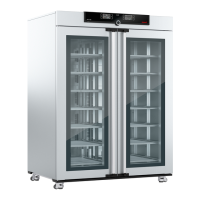
5.6 Graph
The GRAPH display provides an overview of the chronological sequence of the set values and
the actual values as a curve.
5.6.1 Temperature profi le
1. Press the activation key to the
right of the
GRAPH display.
The display is enlarged and
the temperature profile
shown.
0 4 8 12162024
°C
40
20
60
80
100
Fr 20.10.2010 20:34
12.09.2012
14.00 16.00 18.00
38
39
40
► To change the time frame to
be displayed: Press the activa-
tion key next to the ar-
row symbols. The time frame
to be displayed can now be
changed by turning the turn
control.
0 4 8 12162024
°C
40
20
60
80
100
Fr 20.10.2010 20
12.09.2012
14.00 16.00 18.00
38
39
40