5-28 Image Optimization
Score: the score is among 0 to 3.
Normal: when there are a lung sliding sign and A line, or isolated B lines (<3), it is marked
as N in the brackets and the score is 0.
Moderate: when there are multiple clearly-distributed B lines, it is marked as B1 in the
brackets and the score is 1.
Severe: when there are intensively fused B lines, it is marked as B2 in the brackets and
the score is 2.
Lung consolidation: when the lung has a symptom that is similar to the liver lesion
structure and air bronchogram, it is marked as C in the brackets and the score is 3. When
the lung consolidation and pleural effusion occur at the same time, it is marked as C/P in
the brackets and the score is 3.
Dist n (B Line distance): indicates the distance between the 2 neighboring lines and is
measured in the pleura line area, among which, n corresponds to the number between the
2 B lines.
Avg Dist (B Line average distance): indicates the average distance of all B lines.
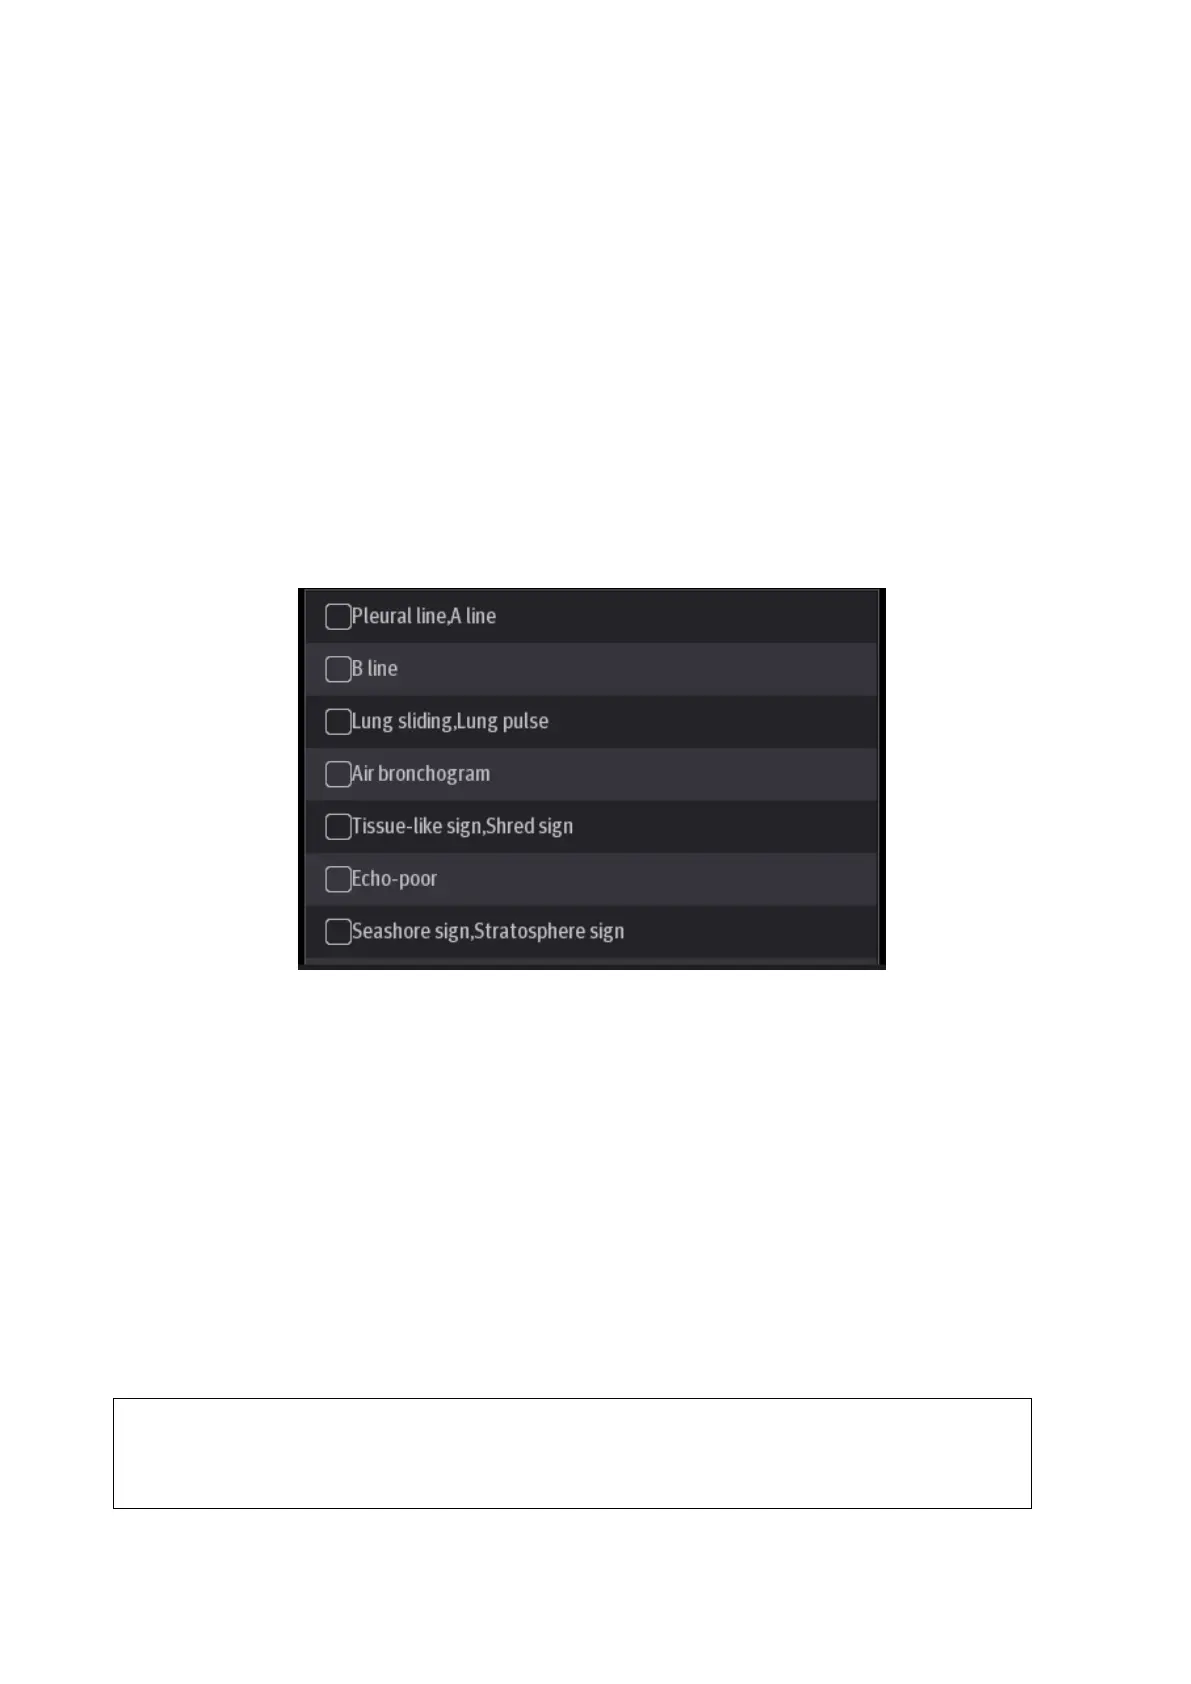
According to the quantitative index calculated by the system, you can add image and
diagnosis information. Tap the check box to select items:
6. Tap [Save Image] at the bottom of the operating panel to save the single-frame image and B
line calculation results.
If necessary, tap [Freeze] again to unfreeze the image. Repeat steps 4-6 to finish calculating
other points.
5.7.2 Overview
After capturing images, tap [Overview] to display the color map of the lung and ultrasound image
of a zone. The color map uses different colors to mark the ultrasound image analysis result of
every lung zone. This analysis result is calculated from the ultrasound image with the highest
percent of B line area.
5.8 Smart VTI
Smart VTI (Velocity-Time Integral) is used to calculate the CO (cardiac output) of the LVOT (left
ventricular output tract), so as to quickly evaluate the cardiac function.
The cardiac package should be configured in advance
Smart VTI supports B mode image calculation in real time.
Perform the following procedure: