Description 4-13
4.6.1 Waterfall
In addition to the spectrum view, another representation has been
introduced in the software, commonly called Waterfall.
The advantage of this view is that the disturbances are shown in a
tridimensional plot. Two dimensions are, as usual, frequency and level, and
the third is the time.
In this way it is possibile to detect and track time-varying signals.
The ranges for Frequency and Level are the same as the Spectrum view.
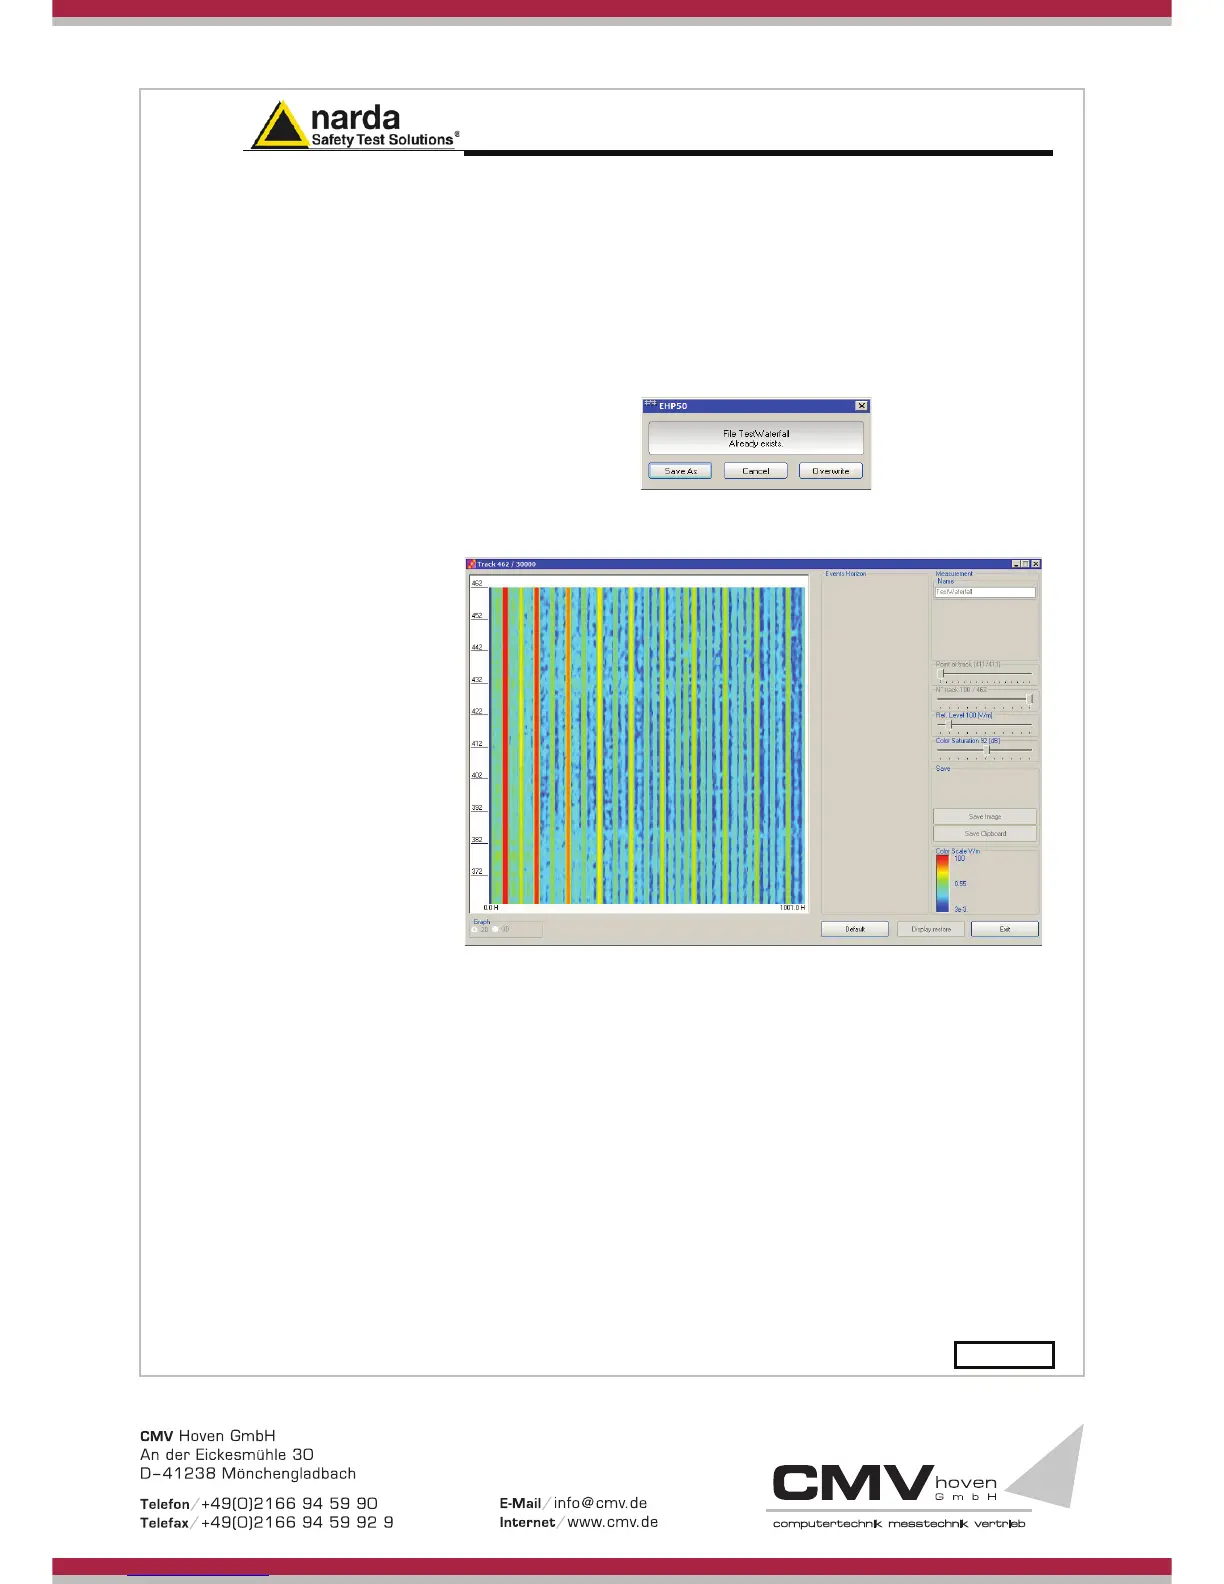
When pressing the Start Waterfall button, a pop-up message can appear
warning the operator if a file with the same name as the one in use, already
exists.
Press Save As to mantain the original file, or Overwrite to cancel the old
measurement with the starting new one.
Fig.4-5 Waterfall - Graph 2D
In the Graph 2D, the horizontal axis represents Frequency, the vertical axis
is the Time and the colour is the Level.
The signal amplitude is represented in a scale of arbitrary colours, usually
the darker the lower and the brighter the higher, like in thermography.
The Color Scale referenced to levels and units, is indicated on the right
bottom of the screen.
The status-bar shows the number of tracks already acquired and the
maximum available.
On the right two sliders permit to set the preferred Reference Level and
Color Saturation (level dynamic range).
Press the Default button to reload standard settings.