Description 4-15
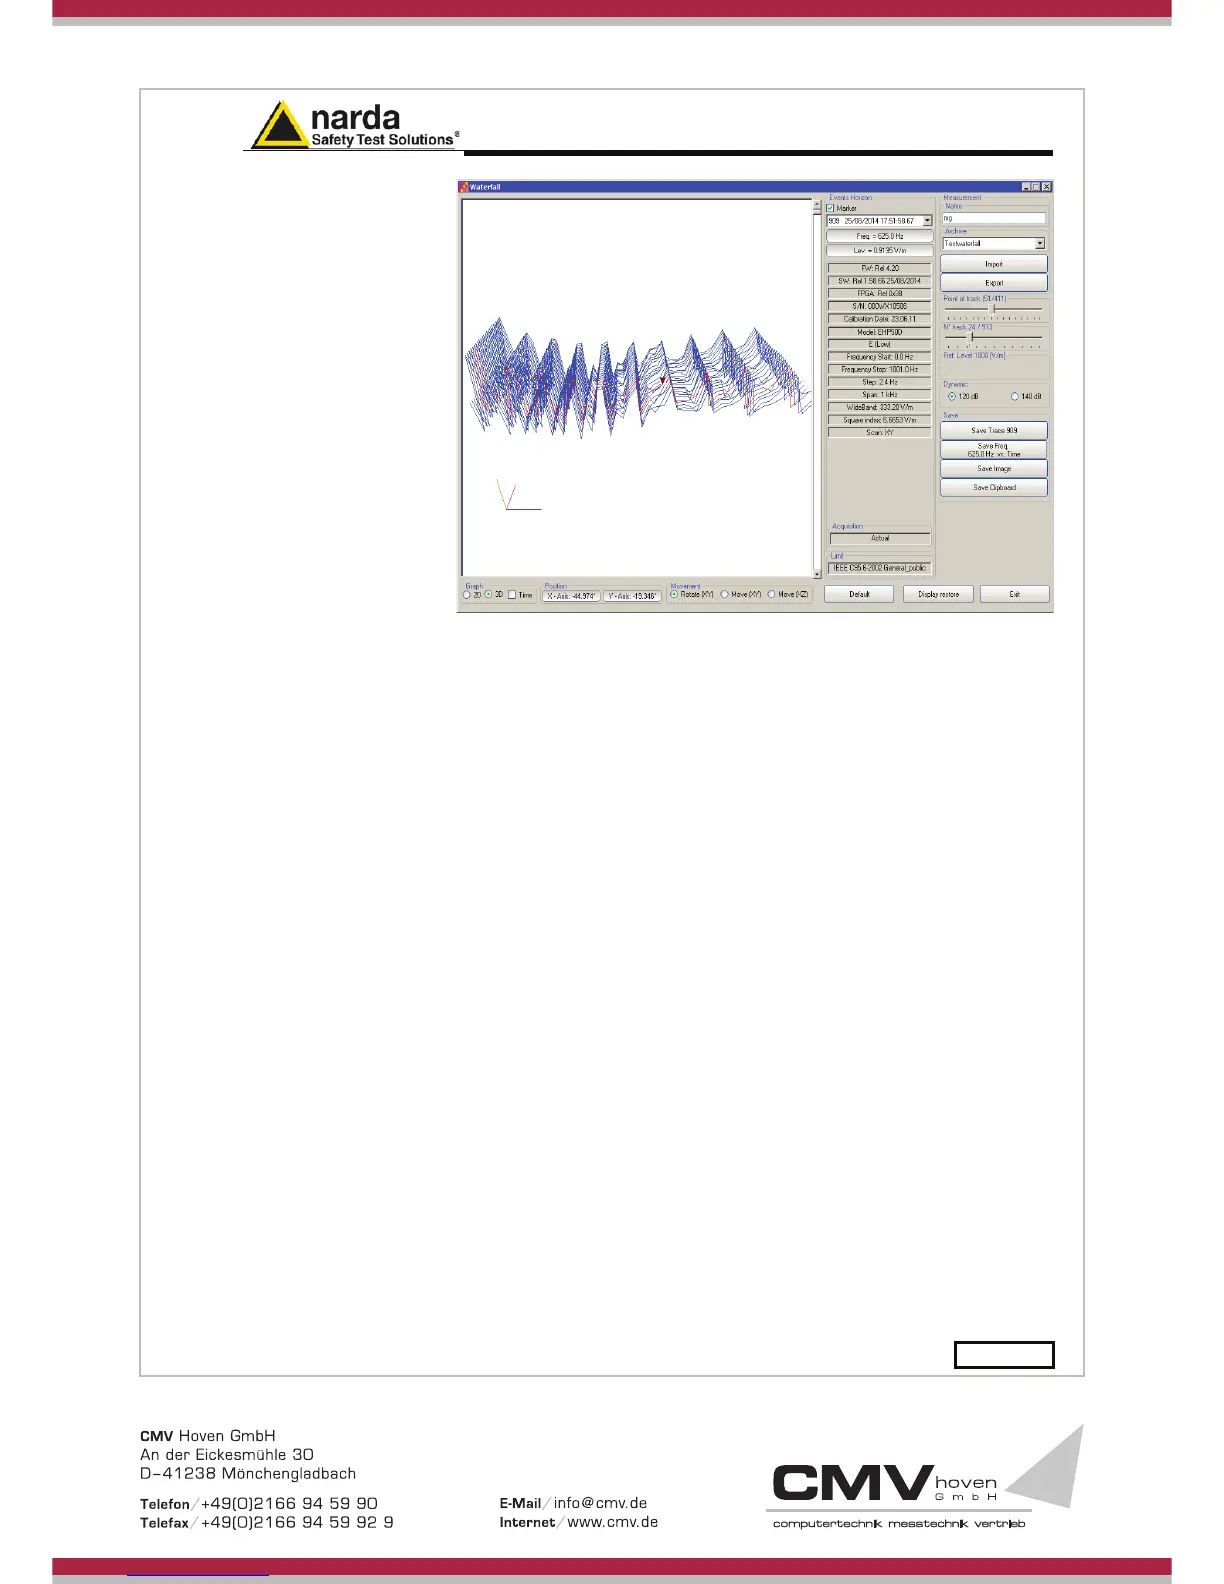
Fig.4-7 Waterfall - Graph 3D
In the Graph 3D, one axis (blue) represents Frequency, another the Level
(green) and the third the Time (red). So the Frequency can be on the
horizontal axis, the Level on the vertical axis and the Time in depth.
For this mode, another box, called Movement, will appear.
Selecting the appropriate functions, you can move, rotate or zoom the view
to your liking, using the mouse.
 Loading...